
The US inflation rate as measured by the Consumer Price Index reached its highest level in forty years during August and September 2021. Consumers face widespread shortages of items whose availability Americans used to take for granted, from autos to smartphones. The cost of housing is rising at the fastest rate on record. Wages are rising fast but unable to keep up with the cost of living, and service businesses can’t find workers. What is happening to the US economy, and what caused it?
The reality is, the United States is midway through a massive social experiment that has no historical precedent. Since the start of the COVID-19 pandemic, the federal government has injected $5.8 trillion of spending power into the US economy. That’s about two-fifths of the consumption component of GDP. That has produced a burst of consumer spending, but also the highest inflation in forty years, along with chronic shortages of key commodities, supply chain disruptions, and a bulge in the trade deficit.
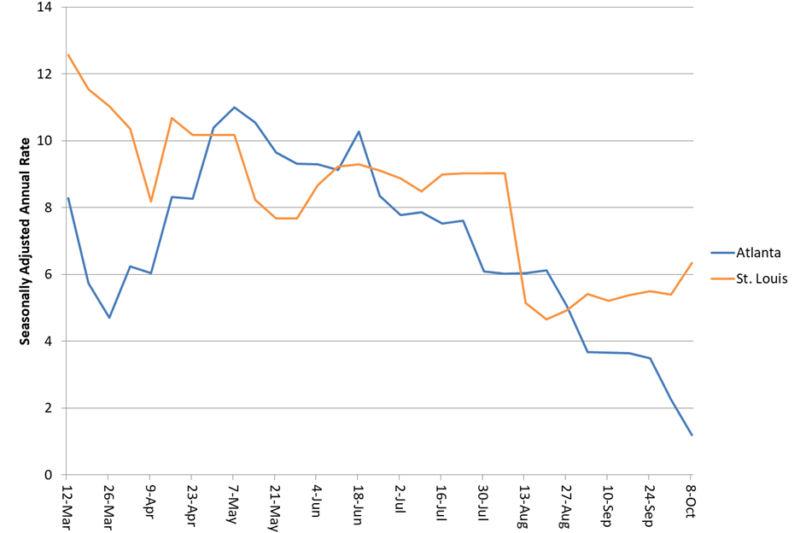
Despite the gigantic stimulus, the economy is slowing, although under these extraordinary circumstances, the usual tools of forecasting are ineffective. Rarely have economic forecasts diverged as widely as they do now, at the beginning of the fourth quarter of 2021. The chart below compares the St. Louis Federal Reserve’s “Nowcast” for third quarter GDP growth to the Atlanta Fed’s “Nowcast” estimate. Both are based on models that translate current economic data releases into a GDP forecast, yet they show strikingly divergent results. The Atlanta Fed model shows third-quarter GDP growth at just 1.2 percent. A similar model at the St. Louis Federal Reserve Bank puts growth at 6.3 percent, close to the consensus forecast.
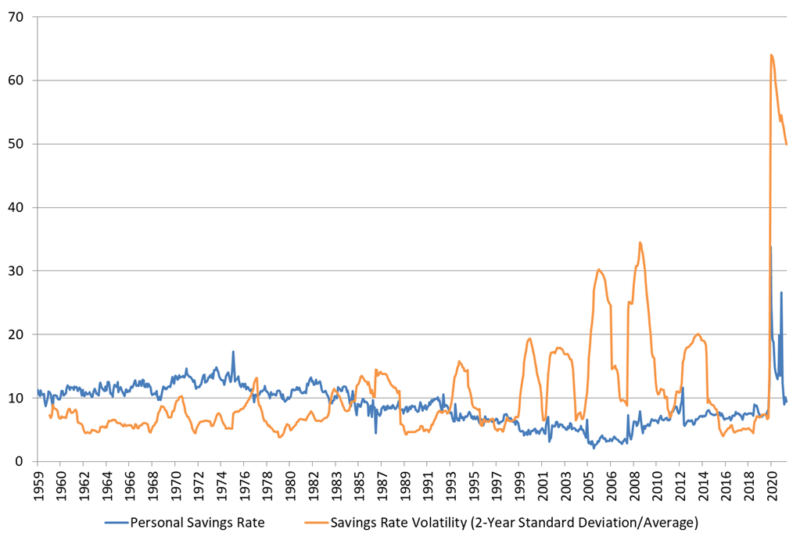
We do not know whether the stimulus will produce continued economic growth with high inflation—perhaps very high inflation—or lead to stagflation, that is, cutbacks in production as well as consumption caused by inflation. The short-term behavior of GDP is determined by consumer saving and spending, according to the standard models. The volatility of the personal savings rate, though, exploded during the past year as consumers pondered whether to save or to spend. Volatility as in the chart below is calculated as the two-year standard deviation of the monthly personal savings rate (personal savings as a percentage of income) divided by the two-year average. The extreme instability of the savings rate of the past two years has no precedent during the past sixty years. This instability turns forecasting short-term economic behavior into a mystical exercise.
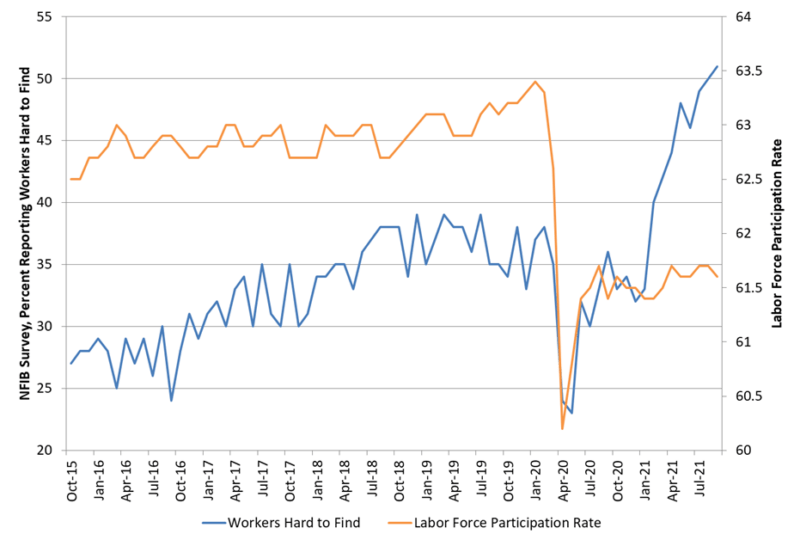
The stimulus had the double effect of boosting consumption and discouraging employment. The highest proportion in history of the National Federation of Independent Business survey reports that workers are hard to find (left-hand scale and blue line in the chart below), while the percentage of the noninstitutional adult population in the workforce dropped sharply and has not recovered (right-hand scale and orange line in the graph).
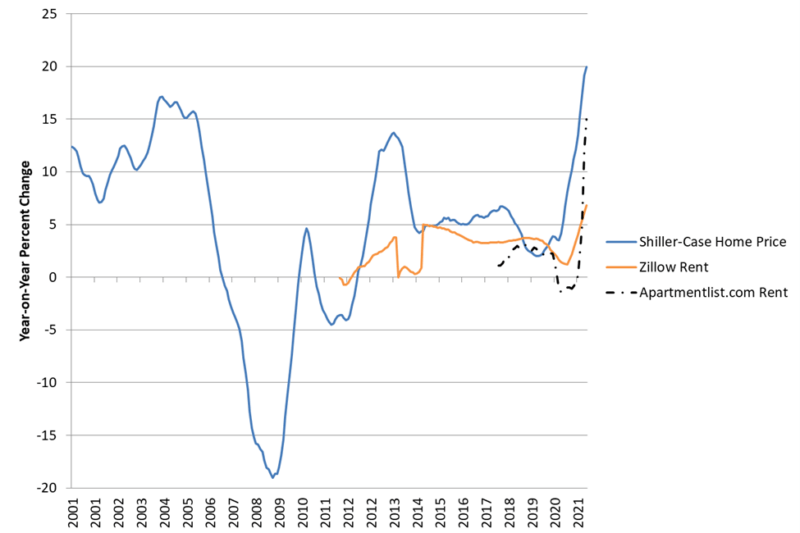
American households and businesses face a degree of uncertainty unlike anything they have seen since the oil shock of the 1970s. The Federal Reserve set the overnight interest rate at zero, which implies a short-term real rate of negative 5 percent to 6 percent after inflation. The intent of negative real rates is to force investment out of savings and into risk assets, including stocks as well as houses. That has happened, with a vengeance, with the fastest home price increases in US history.
Housing prices have risen 20 percent in the past year, the most on record, and rents have risen between 7 percent (Zillow) and 15 percent (apartmentlist.com) according to private surveys. Because current market prices for houses and rentals work their way into the Consumer Price Index with a lag, the housing inflation of the past year portends another 5 percent-6 percent increase in the Consumer Price Index, by my back-of-the-envelope calculation.
How will consumers respond? In the very short term, inflation prompts consumers to spend money faster in order to acquire goods today at lower prices than they expected to pay tomorrow. But real wages are falling (by 1.9 percent year-on-year according to the Bureau of Labor Statistics), and inflation typically prompts consumers to increase savings to compensate for lost wealth.
Businesses cannot raise prices fast enough to keep up with rising input costs. The widely-followed Philadelphia Federal Reserve survey of manufacturers shows that more respondents report higher input costs than higher prices received.
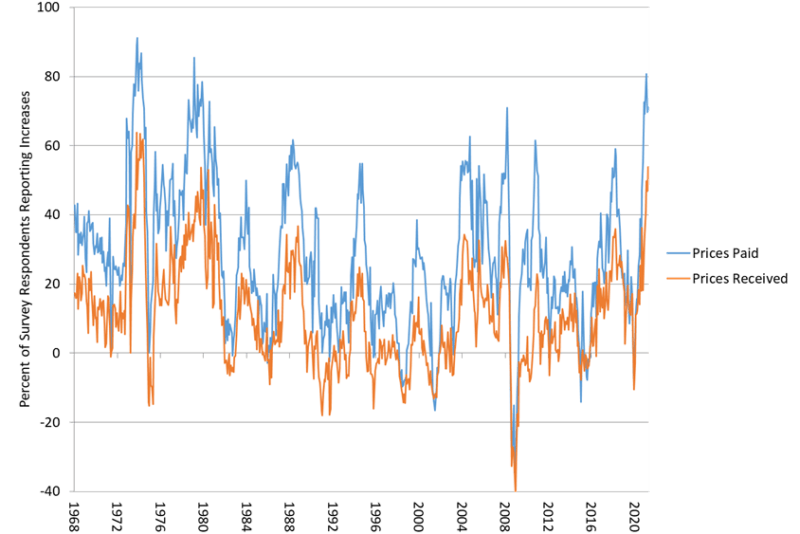
A widening gap between prices paid and prices received often precedes recessions, as in 1973, 1979, 2000, and 2008. This gap does not always predict recessions (it did not in 1993 and 1987, for example). But it strongly suggests that corporate profit margins are under pressure. In some cases, including the US automotive industry, manufacturers have been able to increase profit margins substantially, because a scarcity of cars allowed dealers to eliminate incentives. Overall, the present inflation is likely to constrain production.
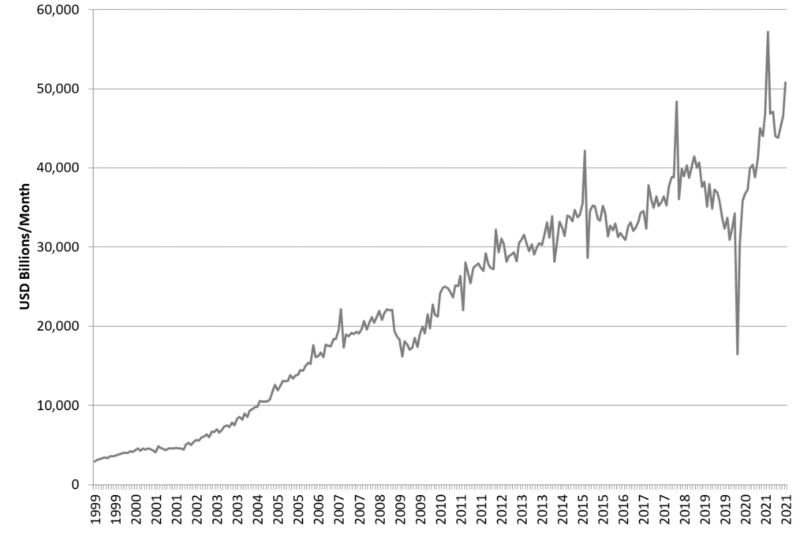
A remarkable development in response to the massive demand stimulus is the jump in American imports from China. The US in September 2021 imported more than $50 billion worth of goods from China, or an annual rate of $600 billion—nearly 30 percent of America’s total manufacturing GDP. That represents an increase of 31 percent from the level of January 2018, when President Trump first imposed tariffs on Chinese imports.
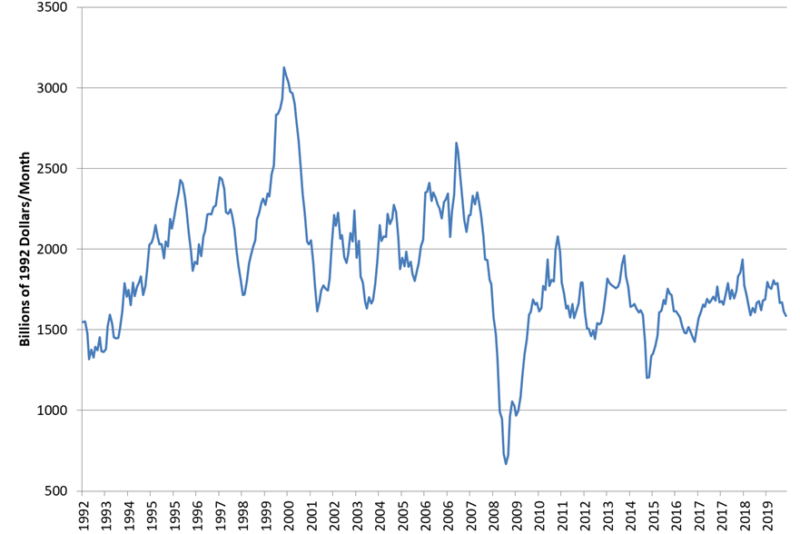
America’s supply chains could not meet the surge in demand created by the stimulus, so American consumers bought more from the world’s largest manufacturer, namely China. The problem lies in chronic underinvestment in US manufacturing. A rough gauge of the state of US manufacturing investment is the level of orders at US companies for industrial machinery. After inflation, this measure stands at the same level as 1992, or half the 1999 peak.
In theory, China could continue exporting to the United States, and continue to lend the United States the money to pay for its goods, for an indefinite period. But China’s supply chains are under pressure, and rising raw materials costs as well as energy prices constrain its ability to produce as well. Prices for China’s manufactured imports are rising, apart from the tariff effect, and that portends more inflation in the United States.
The most likely outcome in my view is that the biggest US consumer stimulus in history will produce sustained inflation in excess of 5 percent a year. Falling real wages and shrinking profit margins will continue to depress output, and the US economy will enter a period of stagflation something like the late 1970s. At some point, the United States Treasury will find itself unable to borrow the equivalent of 10 percent of GDP per year, at least not at negative real interest rates. As long as investors are willing to pay the Treasury to hold their money for them, the US government can sustain arbitrarily large deficits. That is the brunt of so-called Modern Monetary Theory. But the Herb Stein principle applies: Whatever can’t go on forever, won’t. The creditors of the United States will not accept negative returns on an ever-expanding mountain of US debt indefinitely. At some point, perhaps not long from now, the US will face sharply higher interest rates and the type of budgetary constraints that were typical of profligate Third World borrowers.
Reprinted from Law & Liberty
Related Posts

Operation Chokepoint 2.0: The Crypto Crackdown Explained (Video)
In this episode of Liberty Curious, Kate Wand discusses the Obama-era Operation Chokepoint, and today’s “Operation Chokepoint 2.0” with AIER Senior Research Faculty Thomas Hogan. Tom explains how government regulators […]

Earth Day, Waste and Productive Complements
It has been just over half a century since the first Earth Day in 1970. Over that time, April 22 has turned into a day with lots of waste cleanup […]
Focusing Exclusively on “Creating Jobs” Can Do More Harm Than Good
We are constantly bombarded by politicians declaring the importance of “creating jobs” in the economy. We regularly see government initiatives like public works projects, “stimulus” programs, and government subsidies enacted […]