Last year around this time I wrote an article entitled “The Horrors of a Noninflationary Thanksgiving.” In it I showed that consumers seeking traditional holiday fare but choosing only foodstuffs which had not increased in price over the previous year (from 2020 to 2021) would’ve faced a lackluster selection of goods. Between November 2020 and November 2021, the only foods which hadn’t increased in price were hot dogs (without buns or condiments), processed cheese, fresh lettuce (without other vegetables or salad dressing), and a very general category of “cookies.” Without paying up, there would’ve been no turkey, gravy, breadstuffs (rolls, buns, or stuffing), nor cranberry sauce. And to drink, the only stably-priced beverage at that point was water.
Yet in November 2021, the US Consumer Price Index (headline, year-over-year) had only reached 6.2 percent. The Personal Consumption Expenditure Price Index (year-over-year) stood at 5.2 percent. Mostly notably, the Federal Reserve was still referring to the nascent inflation as ‘transitory.’ In a sense they were correct. The general price level within the United States was transitioning from high to much higher levels.
Given policy lag, prices continued their upward march for months after the start of contractionary monetary policy measures in March, 2022. At present, there are hints of disinflation in some goods, but prices of services and for shelter continue upward. Where one year ago the yield on a generic 10-year US Treasury was 1.58 percent, on November 18 it was 3.79 percent.
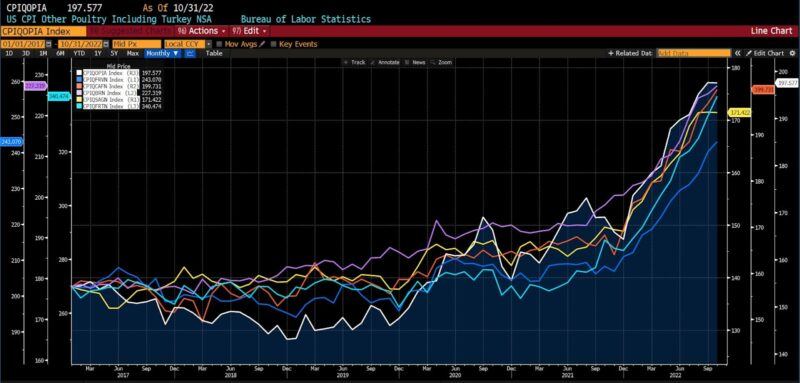
The five-year trend in prices of a Thanksgiving dinner is shown here. All are based upon Bureau of Labor Statistics (BLS) index values, and are not seasonally adjusted. In the below data series white tracks prices of turkey (“and other poultry”); pink for bread; yellow for sauces and gravies; blue for frozen vegetables; orange for canned fruits; and teal for frozen and refrigerated bakery goods.


Below, the percentage changes from 2020 to 2021 and 2021 to 2022 are shown. Because the November index values are not released until mid-December, year-over-year values are based upon the October BLS releases.
| Oct | Oct | Oct | |
| 2020 to 2021 | 2021 to 2022 | 2020 to 2022 | |
| US CPI Other Poultry Including Turkey | 1.68% | 16.89% | 18.86% |
| US CPI Bread | 2.29% | 14.78% | 17.40% |
| US CPI Biscuits, Rolls, and Muffins | 4.76% | 13.57% | 18.97% |
| US CPI Potatoes | 1.66% | 15.19% | 17.10% |
| US CPI Frozen Vegetables | -0.30% | 16.74% | 16.39% |
| US CPI Fresh Vegetables | 1.69% | 8.28% | 10.11% |
| US CPI Canned Fruits | 2.87% | 18.68% | 22.08% |
| US CPI Sauces and Gravies | 1.76% | 14.57% | 16.58% |
| US CPI Food Away from Home | 12.04% | 8.59% | 21.67% |
As also shown, individuals opting to outsource Thanksgiving dinner to restaurants will nevertheless face sharply higher prices this year. And underscoring ubiquitous difficulties in economic measurement, using bread as a proxy for stuffing is misleading. In fact, the US Farm Bureau reports that the price of a 14-ounce bag of stuffing has increased 69 percent since the start of 2022.
In all, the American Farm Bureau Federation estimates that the:
cost of buying a turkey and the trimmings to feed a family of 10 is the highest it’s been in years … The[ir] 37th annual survey puts the average cost of a classic Thanksgiving feast at $65.04 this year, which is a $10.74, or 20 percent, increase over last year’s average $53.31 tab.
But costs associated with Thanksgiving go well beyond comestibles. Many Americans will travel to celebrate the holiday with family or friends, and thus gasoline prices are relevant. Some will travel via bus or train, and others will fly, all of which have seen rising prices. Haircuts, dry cleaned clothes, and pet care are additional expenses. One- and two-year price changes associated with those additional costs are shown below.
| Oct | Oct | Oct | |
| 2020 to 2021 | 2021 to 2022 | 2020 to 2022 | |
| AAA Gasoline (average, US) | 51.64% | 20.00% | 81.97% |
| US CPI Gasoline, Regular Unleaded | 51.28% | 17.07% | 77.11% |
| US CPI Airline Fare | -4.63% | 42.89% | 36.27% |
| US CPI Other Intercity Transportation | 4.60% | 4.07% | 8.85% |
| US CPI Haircuts and Personal Care Services | 4.31% | 5.59% | 10.15% |
| US CPI Pet Services Including Veterinary | 3.93% | 10.67% | 15.02% |
| US CPI Laundry and Dry Cleaning | 6.92% | 7.19% | 14.61% |
As always, price increases have numerous causes: supply problems caused by the war in Ukraine (especially where grains are concerned), an outbreak of bird flu, etc. But those are relative changes which the price system acts to mediate, signaling shortages to producers and entrepreneurs domestically and worldwide. The massive upward trend in the general price level has to do with one factor alone: the massive, expansionary monetary policy efforts pursued throughout 2020 and 2021.
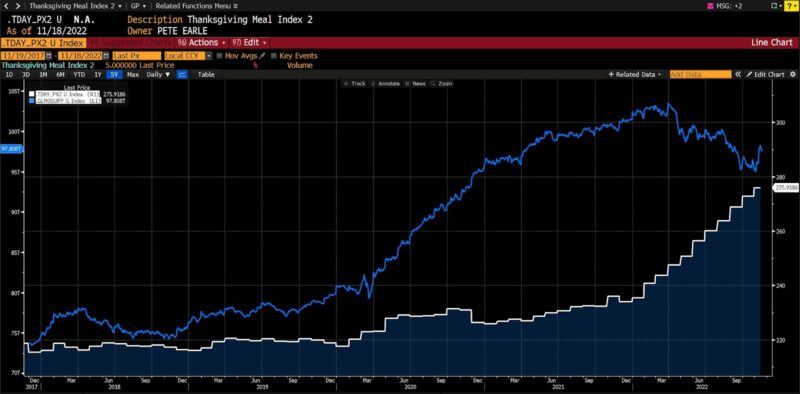
The below chart tracks a proprietary Thanksgiving Meal Index composed of turkey, gravy, bread, frozen vegetable, canned fruit, and frozen/refrigerated bakery goods prices (white) versus the global M2 money supply (blue, in USD) over five years. The stepwise appearance of the Thanksgiving Meal Index owes to its composition of monthly data releases.


Americans face another costly holiday season owing to the heavy-handed and arguably unnecessary monetary and fiscal programs early in the COVID pandemic. Despite recent attempts to frame inflation as inevitable or even beneficial, both the rise of the price level and the delay in combating it lay squarely at the feet of the Federal Reserve.
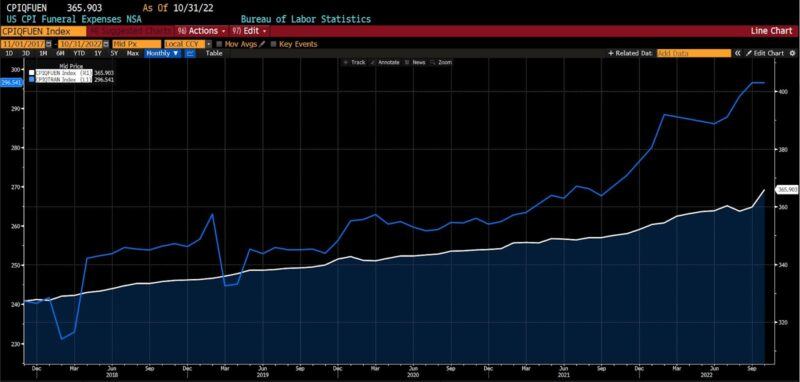
US CPI Funeral Expenses & US CPI Tax Preparation (5 years)


And with respect to traditional notions of inevitability, prices of both “death and taxes” have increased as well. The costs associated with funerals and tax preparation have risen just under 5 percent and 10 percent, respectively, over the last twelve months.


