
Sales of existing homes sank another 5.4 percent in June, to a 5.12 million seasonally adjusted annual rate. That is the fifth consecutive monthly decline leaving the selling pace at the lowest level since June 2020 following the lockdown recession. Sales were down 14.2 percent from a year ago and 21.1 percent from the January peak.
Sales in the market for existing single-family homes, which account for about 89 percent of total existing-home sales, dropped 4.8 percent in June, coming in at a 4.57 million seasonally adjusted annual rate (see first chart). Sales were down 12.8 percent from a year ago and 20.5 percent from the January peak. Single-family sales also fell for the fifth consecutive month and were at their slowest pace since June 2020.
The single-family segment saw sales decline in three of the four regions. Sales fell 10.6 percent in the West, 5.6 percent in the South, the largest region by volume, and 0.9 percent in the Midwest, while sales were unchanged in the Northeast, the smallest region by volume. Measured from a year ago, sales were down in all four regions (-20.8 percent in the West, -11.5 percent in the South, -11.1 percent in the Northeast, and -9.4 percent in the Midwest).
Condo and co-op sales fell 9.8 percent for the month, leaving sales at a 550,000 annual rate for the month versus 610,000 in May (see first chart). Measured from a year ago, condo and co-op sales were off 24.7 percent, and were at their slowest pace since June 2020.
Condo and co-op sales were down in three regions in June, falling 14.3 percent in the West, 12.5 percent in the Midwest, and 10.7 percent in the South while sales were unchanged in the Northeast. From a year ago, sales were down in all four regions (-30.6 percent in the South, -25.0 percent in the West, -15.4 percent in the Northeast, and -12.5 percent in the Midwest).
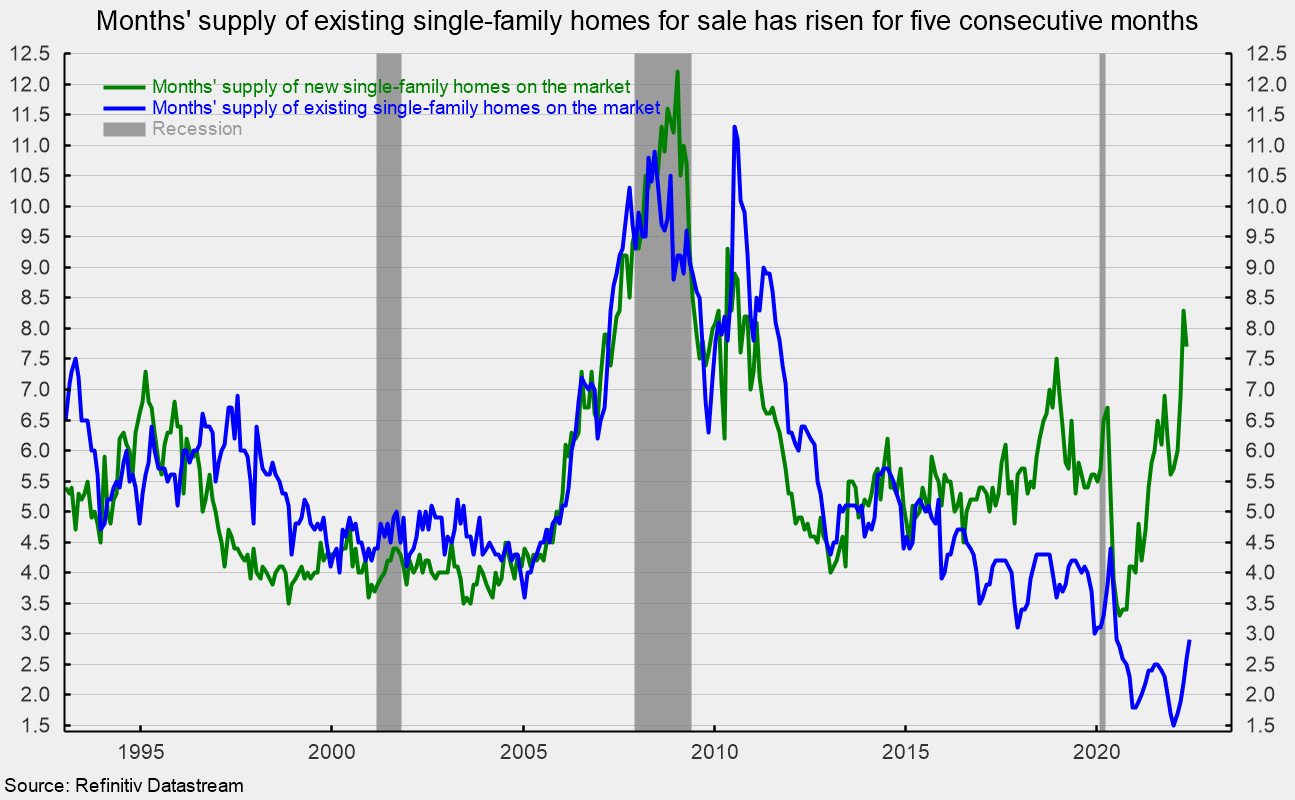
Total inventory of existing homes for sale rose in June, increasing by 9.6 percent to 1.26 million, leaving the months’ supply (inventory times 12 divided by the annual selling rate) up 0.4 months at 3.0, the highest since November 2020 but still low by historical comparison, but the fifth consecutive increase.
For the single-family segment, inventory was up 9.8 percent for the month at 1.12 million and is 5.7 percent above the June 2021 level. The months’ supply was 2.9, up from 2.6 in the prior month, matching the July 2020 result (see second chart).
The condo and co-op inventory increased 7.7 percent to 140,000, pushing the months’ supply up to 3.1 from 2.6 in May. Months’ supply is 10.7 percent above June 2021 and has risen for five consecutive months.
Related Posts

Operation Chokepoint 2.0: The Crypto Crackdown Explained (Video)
In this episode of Liberty Curious, Kate Wand discusses the Obama-era Operation Chokepoint, and today’s “Operation Chokepoint 2.0” with AIER Senior Research Faculty Thomas Hogan. Tom explains how government regulators […]

Earth Day, Waste and Productive Complements
It has been just over half a century since the first Earth Day in 1970. Over that time, April 22 has turned into a day with lots of waste cleanup […]

Focusing Exclusively on “Creating Jobs” Can Do More Harm Than Good
We are constantly bombarded by politicians declaring the importance of “creating jobs” in the economy. We regularly see government initiatives like public works projects, “stimulus” programs, and government subsidies enacted […]