
Total housing starts rose to a 1.702 million annual rate in December from a 1.678 million pace in November, a 1.4 percent increase. From a year ago, total starts are up 2.5 percent. Total housing permits were very strong in December, posting a 9.1 percent gain to 1.873 million in December from 1.717 million in November (see first chart). Total permits are up 6.5 percent from the December 2020 level.
Starts in the dominant single-family segment posted a rate of 1.172 million in December versus 1.199 million in November, a drop of 2.3 percent and are down 10.9 percent from a year ago. Single-family permits experienced a 2.0 percent rise to 1.128 million versus 1.106 million in November. Single-family starts are about the same level as they were in October 2020 while single-family permits are about even with their September 2020 level (see first chart).
Starts of multifamily structures with five or more units increased 13.7 percent to 524,000 and are up a robust 56.0 percent over the past year while starts for the two- to four-family-unit segment were down 66.7 percent at a 6,000-unit pace versus 18,000 in November. Combined, multifamily starts were up 10.6 percent to 530,000 in December and show a gain of 53.2 percent from a year ago.
Multifamily permits for the 5-or-more group rose 19.9 percent to 675,000 while permits for the two-to-four-unit category jumped 45.8 percent to 70,000. Combined, multifamily permits were 745,000, up 21.9 percent for the month (see first chart) and 41.9 percent from a year ago.
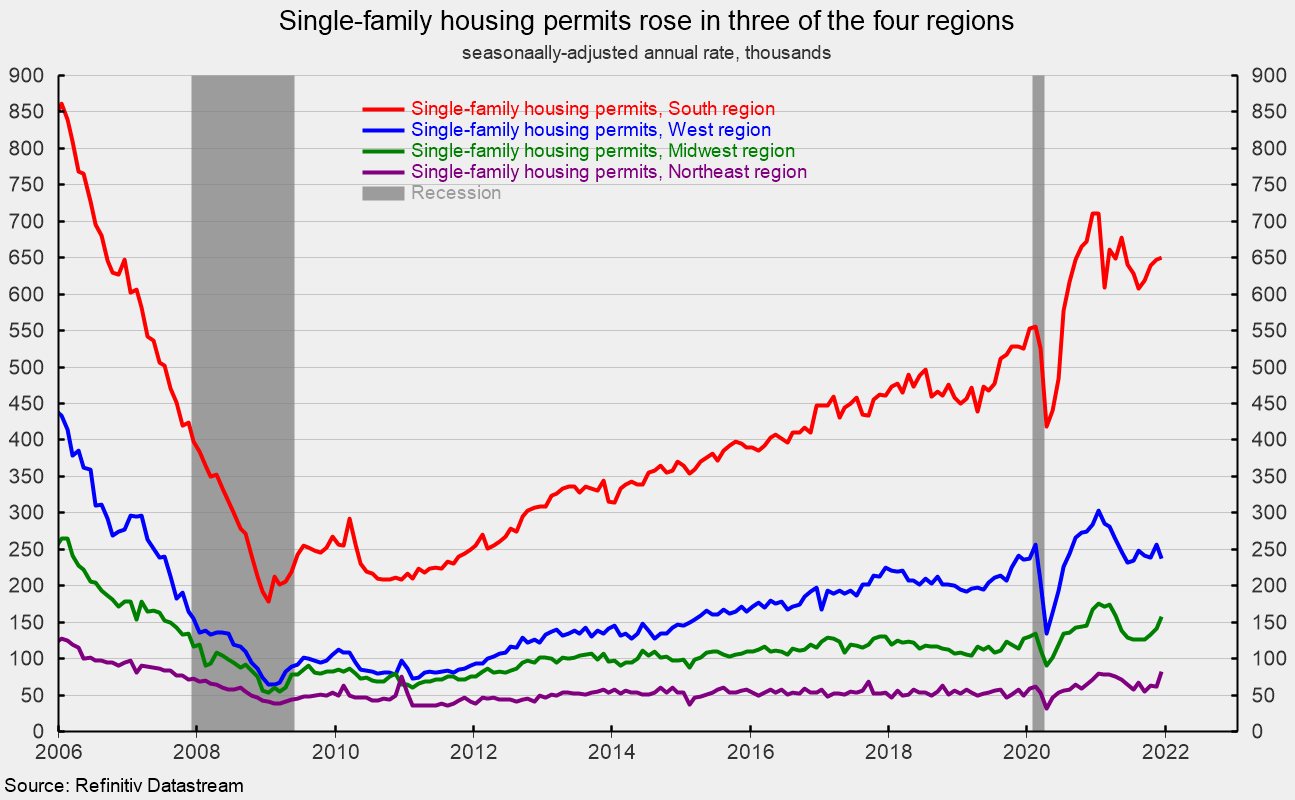
Regionally, single-family permits were up in three regions: the West saw a 7.0 percent drop to 238,000 while the South managed a modest 0.5 percent increase to 650,000, the Midwest gained 12.1 percent to 158,000, and the Northeast gained 32.3 percent to 82,000 in December (see second chart).
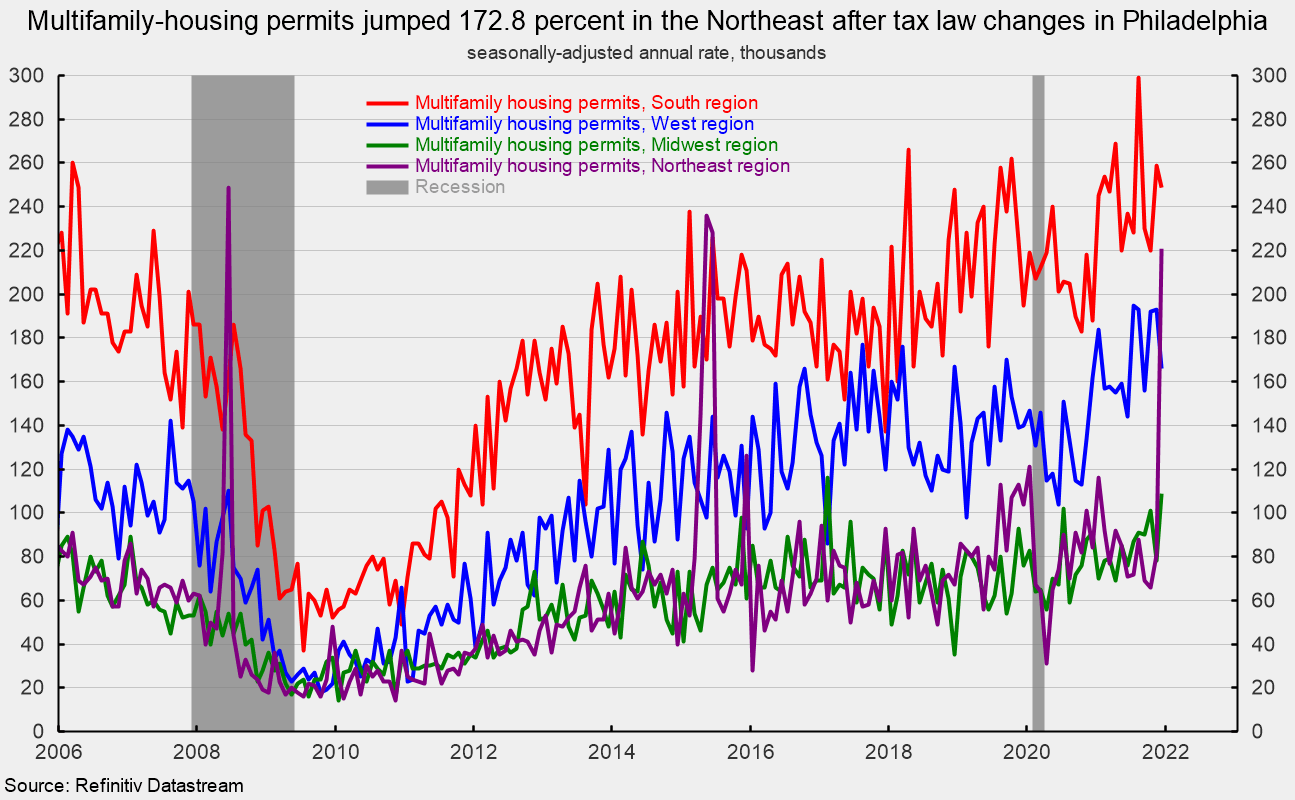
Multifamily permits had two regions with gains in December. The Northeast surged 172.8 percent to 221,000 and the Midwest jumped 39.7 percent to 109,000. On the downside, the South fell 3.9 percent to 249,000 and the West dropped 14.0 percent to 166,000 (see third chart). The surge in the Northeast was largely driven by a jump in permits in the Philadelphia area as tax law changes were enacted affecting real estate permits issued after December 31, 2021.
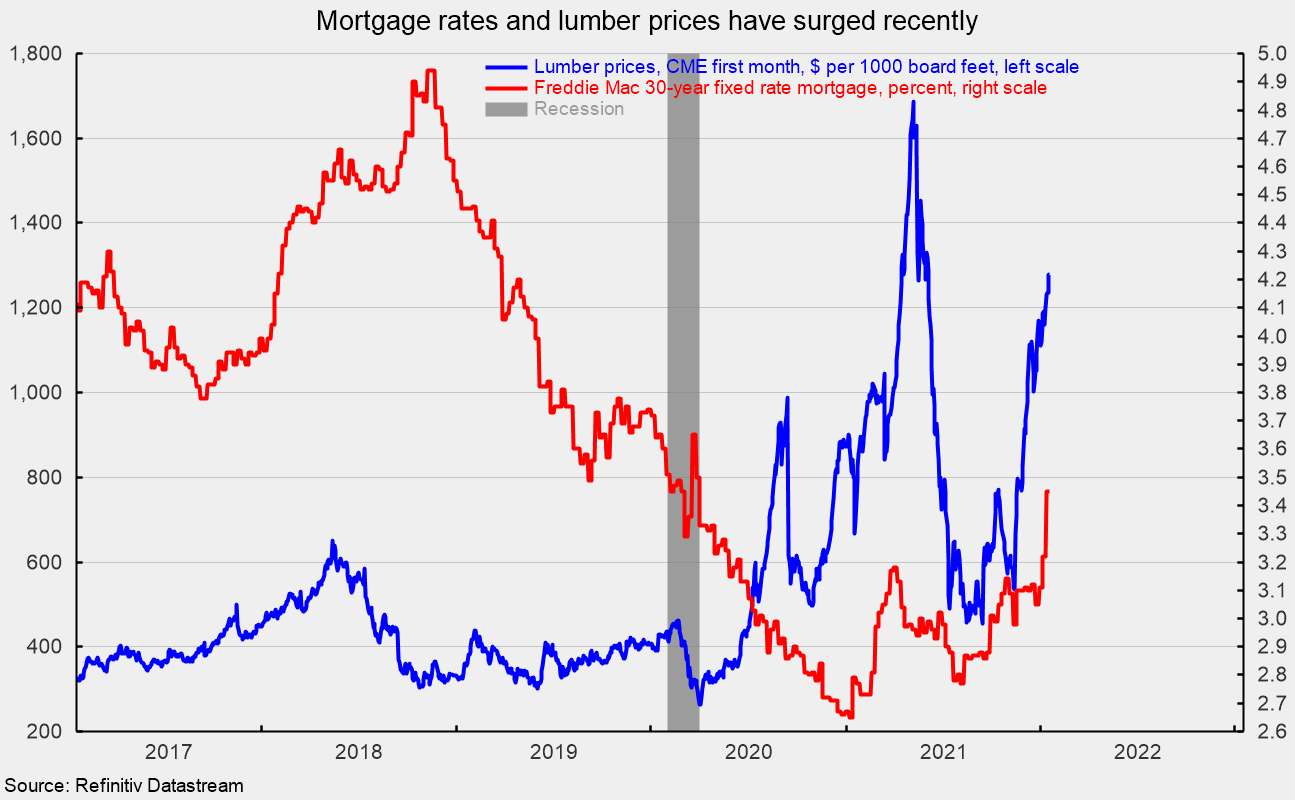
Lumber prices are once again soaring, coming in around $1,279 per 1,000 board feet in mid-January (see fourth chart). The increase in lumber costs will pressure profits at builders and may lead to more price increases for new homes. (See fourth chart). Furthermore, mortgage rates have jumped recently, with the rate on a 30-year fixed rate mortgage hitting 3.45 percent in mid-January (see fourth chart). Higher home prices and higher mortgage rates are likely to slow future housing activity.
Meanwhile, the National Association of Home Builders’ Housing Market Index, a measure of homebuilder sentiment, fell back slightly in January, coming in at 83 from 84 in December, but remains at a generally favorable level. Overall sentiment remains relatively high, but inflation and supply chain disruptions continue to be significant problems. It should be noted, the survey was taken in early January before the recent jump in mortgage rates. The impact of higher rates, if they are sustained, are likely to be more fully reflected in the February Housing Market Index.
Two of the three components of the Housing Market Index fell in January. The expected single-family sales index fell to 83 from 85 in the prior month and the traffic of prospective buyers index was down to 69 from 71 in December but the current single-family sales index remained unchanged at 90.
After a pullback in activity in the first three quarters of 2021, single-family activity showed some strength. While the implementation of permanent remote working arrangements for some employees may be providing continued support for housing demand, ongoing home price increases combined with the recent surge in mortgage rates may work to cool activity in coming months.
Related Posts

Operation Chokepoint 2.0: The Crypto Crackdown Explained (Video)
In this episode of Liberty Curious, Kate Wand discusses the Obama-era Operation Chokepoint, and today’s “Operation Chokepoint 2.0” with AIER Senior Research Faculty Thomas Hogan. Tom explains how government regulators […]

Earth Day, Waste and Productive Complements
It has been just over half a century since the first Earth Day in 1970. Over that time, April 22 has turned into a day with lots of waste cleanup […]

Focusing Exclusively on “Creating Jobs” Can Do More Harm Than Good
We are constantly bombarded by politicians declaring the importance of “creating jobs” in the economy. We regularly see government initiatives like public works projects, “stimulus” programs, and government subsidies enacted […]