
Industrial production gained 0.5 percent in February despite a reversal of the weather-related surge in utility output in January. The gain pushes total industrial output to its highest level since December 2018, and clearly above the December 2019 level prior to the pandemic (see first chart). Over the past year, total industrial output is up 7.5 percent.
Total industrial capacity utilization increased 0.3 points to 77.6 percent from 76.3 percent in January, the highest since March 2019 (see first chart). However, total capacity utilization remains well below the long-term (1972 through 2021) average of 79.5 percent.
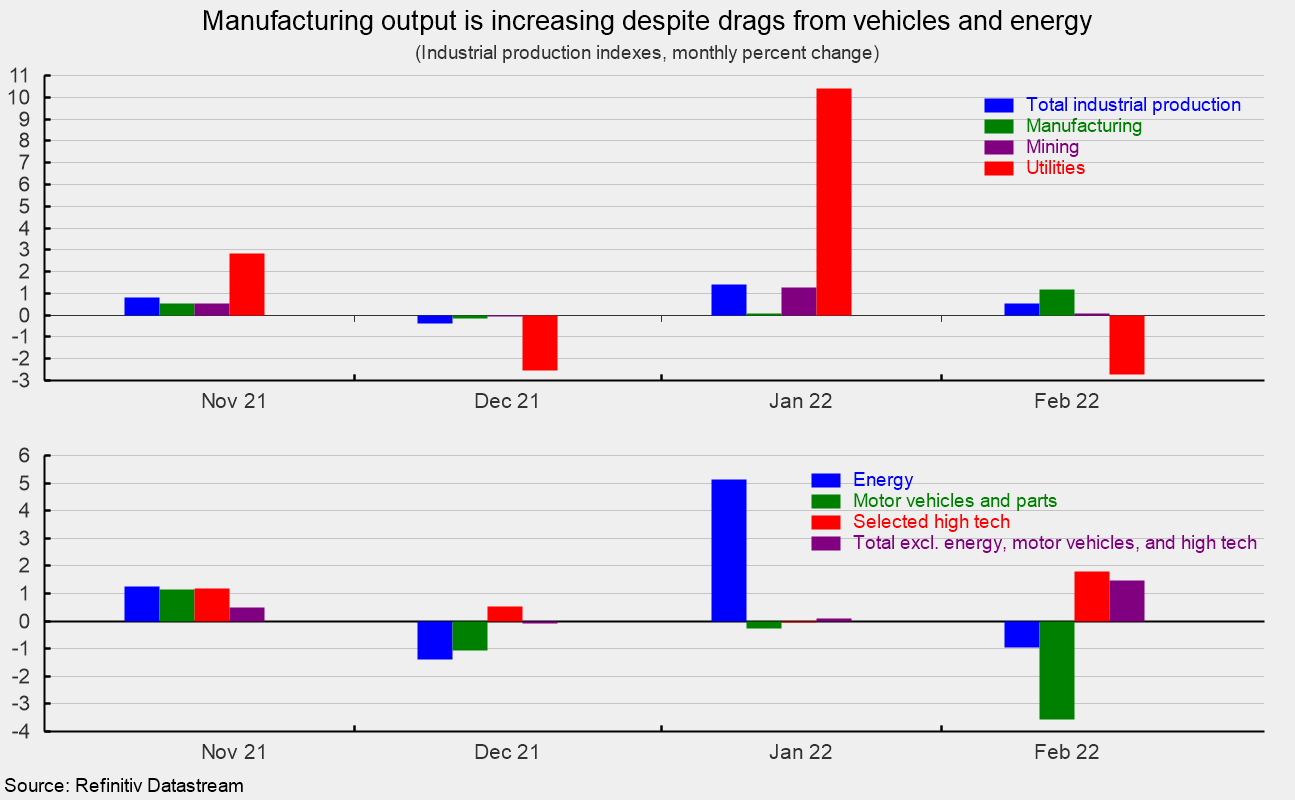
Manufacturing output – about 74 percent of total output – posted a more robust 1.2 percent increase for the month (see first chart). Manufacturing output is at its highest level since September 2018 and is 2.9 percent above its January 2019 pre-pandemic level (see first chart). From a year ago, manufacturing output is up 7.4 percent.
Manufacturing utilization increased 0.9 points to 78.0 percent, well above the December 2019 level of 75.6 percent and the highest level since September 2018, but just slightly below its long-term average of 78.1 percent. However, it remains well below the 1994-95 high of 84.7 percent (see first chart).
Mining output accounts for about 14 percent of total industrial output and posted a modest 0.1 percent increase last month (see top of second chart). Over the last 12 months, mining output is up 17.3 percent. Utility output, which is typically related to weather patterns and is about 12 percent of total industrial output, sank 2.7 percent, partially reversing the January surge of 10.4 percent (see top of second chart) with natural gas off 12.1 percent and electric down 0.9 percent. From a year ago, utility output is off 1.2 percent.
Related Posts

Operation Chokepoint 2.0: The Crypto Crackdown Explained (Video)
In this episode of Liberty Curious, Kate Wand discusses the Obama-era Operation Chokepoint, and today’s “Operation Chokepoint 2.0” with AIER Senior Research Faculty Thomas Hogan. Tom explains how government regulators […]

Earth Day, Waste and Productive Complements
It has been just over half a century since the first Earth Day in 1970. Over that time, April 22 has turned into a day with lots of waste cleanup […]

Focusing Exclusively on “Creating Jobs” Can Do More Harm Than Good
We are constantly bombarded by politicians declaring the importance of “creating jobs” in the economy. We regularly see government initiatives like public works projects, “stimulus” programs, and government subsidies enacted […]