
Thanks for having me, it’s great to be here. When I was originally asked about this event I commented to one of my colleagues that I was disappointed that I wouldn’t be traveling to Manitoba in person. He asked me when this event was being held, and when I responded “December 14th,” he smiled and said: “Shows how much you know.”
Nevertheless, I’m happy to be here, albeit virtually.
My name is Pete Earle, and I’m an economist at the American Institute for Economic Research in Great Barrington, Massachusetts.
In early October 2021 I wrote an article entitled “An Armor Conspired: the Global Shipping Freeze,” in which I attempted to chronicle the root causes and provide a timeline for the growing shipping delays. The words “an armor conspired” made reference to a poem by Jim Morrison entitled “Horse Latitudes,” in which he alludes to times and places where “the sullen sea conspires an armor.” I was quick to point out that while he had considerable writing talents, Morrison was, by many accounts, not a great person. As far as I know, he was not a great economist either. But in the horse latitudes to which the poet refers, mariners would at times be forced to throw nearly everything overboard in order to lighten their craft, catch the faintest breezes in their sails, and escape the doldrums.
I turn now to this, which is, to me, a miracle and a wonder of the modern world. This is a somewhat obscure index captured by the US Census Bureau and entitled the “Manufacturing and Trade Inventory-to-Sales Ratio, for Total Business.”
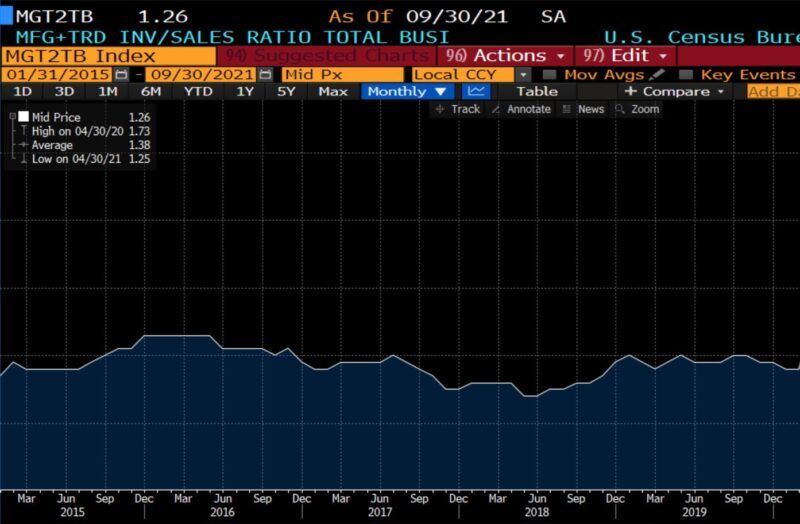
And that’s all it is: a ratio of the total final inventory that firms keep on hand divided by total sales. What’s remarkable to me about this graph is its extraordinary balance and consistency. Yes, it employs mathematical averages. But despite changes in consumer preference and tastes, a constant avalanche of new and improved goods arriving in the marketplace, and ceaseless technological innovation, firms of various sizes – with heterogeneous entrepreneurial talents and various financial and physical capital wherewithal – by and large stock their inventory to match [expected] sales with extraordinary efficiency.
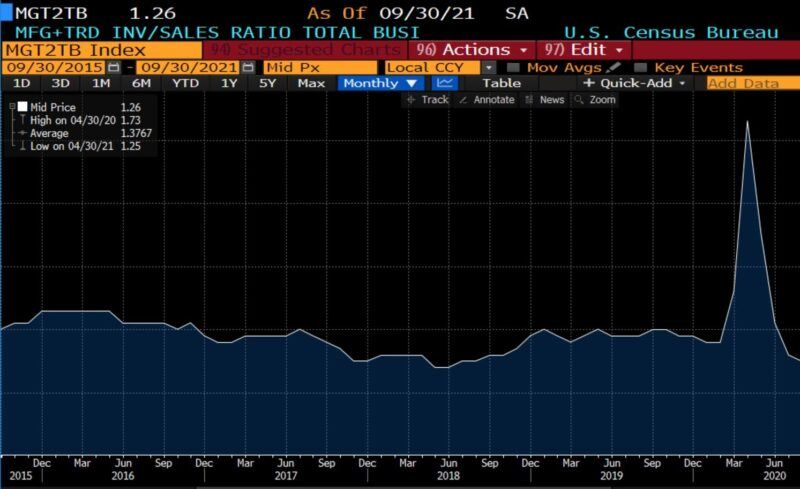
Over a longer timeframe this graph reveals two other things: first, that this was not achieved overnight. There was a long period within which a downward trend was in evidence, showing less and less inventory held in anticipation of sales with the growing power and sophistication of inventory management technology and big data. And second, that during recessions, the ratio is thrown completely askew, spiking up as consumers either can’t or choose not to purchase goods, and then slowly falling back to normal levels, indicating the return of normal conditions.
But there is a vastly more important takeaway from this obscure data and chart. It’s that hundreds of thousands of firms, run by private actors with various levels of expertise and experience, and focusing upon a wide spectrum of goods, are able to match changing demand and supply extraordinarily well (even despite seasonality) without a Ministry of Stuff run by a Satisfaction Czar issuing directives. The price system transmits local information, informs of surplus or scarcity, and rewards those who plan best. Over time resources flow to those who are verifiably the most capable commercial stewards.
We will come back to this.
In my article I attempted to outline the major causative factors which, in early October, led to hundreds of ships floating off of major ports waiting to dock and offload their cargo. Those numbers are made all the more staggering when compared to the average number of ships waiting at those same ports in ordinary times: zero to one.
Most of that cargo is in the form of intermodal shipping containers, another miracle of the modern world. The causality as I outlined it traces as follows.
For decades, ports in the US have operated on the basis of some of the shortest daily operating hours in the world, often with outdated equipment and technology. That’s largely a function of powerful, long-term collective bargaining agreements and the ports being government agencies. Most other ports in the world operate 24/7 with computerized, and in some cases automated, equipment.
And so in March 2020 the initial response to the Covid-19 pandemic was made with a combination of lockdowns, stay-at-home orders, social distancing, and a host of other nonpharmaceutical interventions. Needless to say, business inventories skyrocketed.
Shortly thereafter a two-punch combination of economic policy responses came. A massive, internationally-coordinated raft of expansionary monetary policy measures, and a huge, multistage fiscal stimulus program. This explosion of liquidity, with hundreds of millions of people around the world stuck at home, resulted in a nuclear blast of consumptive activity. It’s important to note that owing to the nature of the lockdowns this was almost entirely a goods- rather than service-focused discretionary spending binge.
The impact of that is seen here: inventories being drawn off of shelves, away from warehouses and other storage facilities and in fact, the very beginnings of difficulty keeping up with demand.
The first shock, in March 2021, came in the form of the lodging of the massive Ever Given container ship in the Suez Canal. That held up 12% of global shipborne trade for six days, ultimately delaying almost 500 ships from reaching their destinations, and leading others to replot their routes.
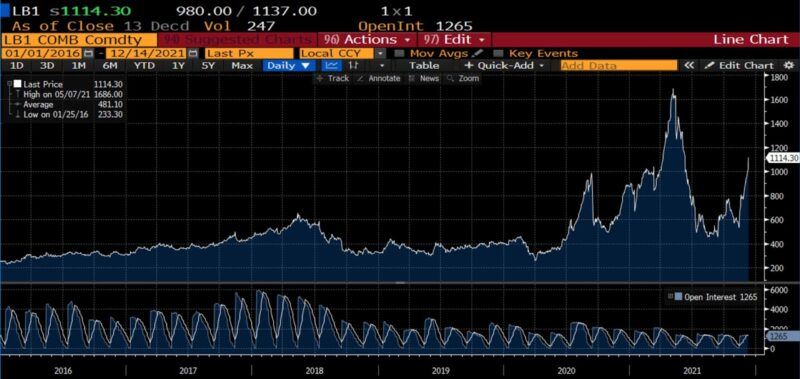
At this point another factor came to the fore. Having to do with pandemic policy effects on lumber markets, owing to mill closures in the US and Canada, and a massive surge of interest in home improvement projects, lumber prices went from between $300 and $600 per thousand board-feet to almost $1,700 per thousand board-feet. This means that pallets, which are required in shipping containers, were suddenly in short supply, bid away by home builders and do-it-yourselfers.
In late May 2021, the Chinese port known as Yantian closed owing to a new Covid outbreak. It’s a port that usually handles some 30,000 20-foot-containers a day. That closure sent Shanghai to Rotterdam rates up 500%, such that rates which had for years only cost between $1,500 and $2,000 per container now cost over $10,000 per container (for the first time ever).
A few months later (in what I thought, probably incorrectly, would be the quintessential moment in the shipping quandary) the Chinese port at Ningbo-Zhoushan closed. It’s a massive port, but the reason for the closure is emblematic: a lone, 34-year-old male worker who was described as asymptomatic tested positive for Covid. And this is the point at which the fragility of US ports, and in particular West Coast ports, was exposed.
With a much larger proportion of available containers floating rather than being taken up at ports by sweeper ships, and with the notably fewer available containers unable to be filled with pallets, prices of containers and routes took another leg up.
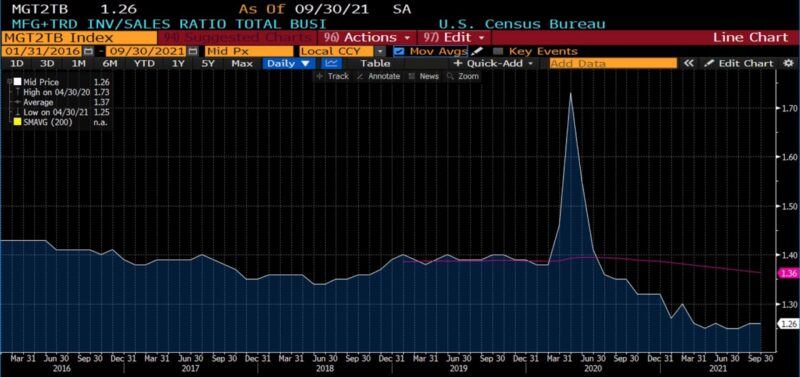
Which brings us back to the Manufacturing and Trade Inventory-to-Sales Ratio.
Remembering that inventories are in the numerator and sales in the denominator, it’s logical that during a recession – or an artificial, self-inflicted depression, such as nonpharmaceutical interventions contemplate – the value of the ratio would shoot up as inventories grew and sales fell. They would then normalize. But what has rarely been seen over the history of this index happened next: inventories shrank, as sales stayed the same or grew. That can be seen in the value of the ratio falling below roughly 1.35, which was the average for many years.
I finished that article by summarizing the state of affairs in this way:
There is an unavoidable price for the ceaseless avalanche of goods and services falling around us: it is exposure to an arrant, inherent level of complexity. Only the coordination of a superabundant array of prices, timing, capacity, and information keeps the globally-integrated supply chain functioning. A single, small misstep or error increases the likelihood of subsequent problems at every juncture in the process … Science and engineering have brought about an era in which doldrums no longer vex modern day mariners…there are no longer horse latitudes where payloads are dumped overboard by desperate crews. Yet those conditions have reemerged … The idea that an economy could be indiscriminately shut down and turned back on without far-reaching consequences, as if a light switch or lawn mower, is utterly damnable.
And now, some updates.
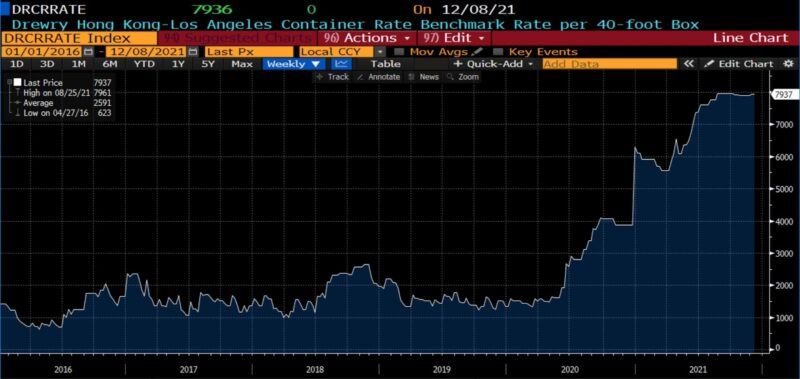
In terms of shipping rates, when the original article was published in early October, it cost $7,961 to ship a container from the Hong Kong area to Los Angeles as per the Drewry Benchmark Rate. As of yesterday the rate was $7,937; less than a $30 difference.
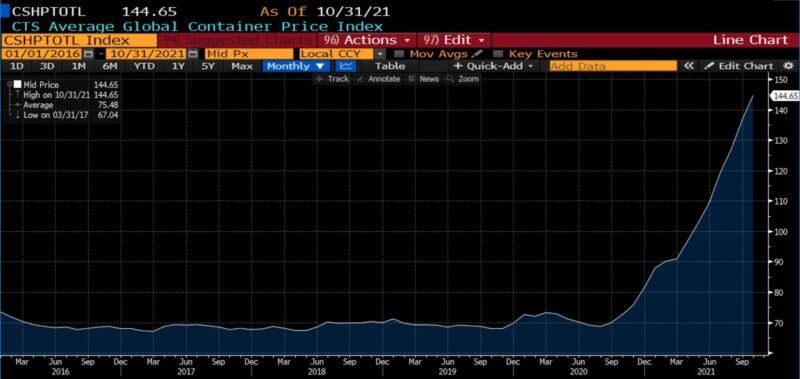
As for containers themselves, per the CTS Global Average Container Price Index, the measure was 126.86 in early October and is now 144.65: 14% higher.
Lumber, used in pallets, had fallen from a five or more decade high of almost $1,700 per thousand board feet to below $500. It has now risen again to over $1,000 per thousand board feet. (Those are front month contract prices in the futures markets.)
Yet despite those factor prices and indices being the same or higher than they were in early October, there are reports that congestion issues are easing on the West Coast of the United States. Those accounts are true in a certifiable or an existential sense, but whereas the number of ships waiting to dock in early November was roughly 80, today that number is closer to 100.
What has changed is the method of counting ships. The standard measure was to count all inbound ships which were within 40 miles of the port. In mid-November that procedure was adjusted to keep a certain number of ships outside the 40-mile zone, assigning them a calculated time of arrival not when they arrived from, but when they left their prior port. Thus there are indeed more delayed ships, but they are being dispersed more widely and counted differently administratively.
So there has been little improvement. It would be more accurate to describe circumstances as having infected the broader shipping and transportation ecosystem.
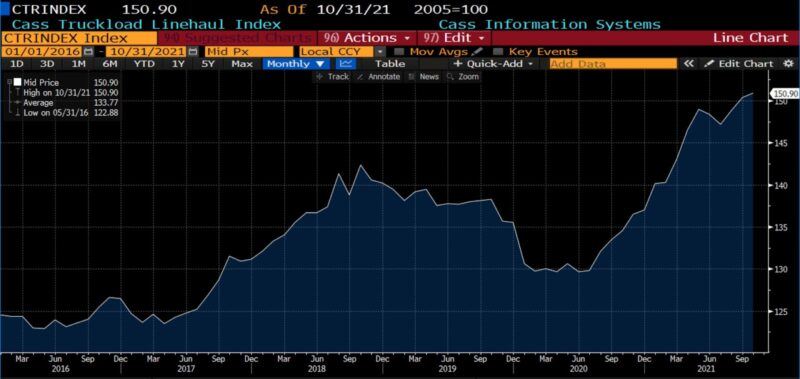
With respect to those containers that have actually made it off of ships, drayage truckers – that’s truckers at ports – are reporting flawed appointment systems, long waits, and other inefficiencies. The shipping crisis has now additionally exposed a deep chasm in highway transportation. While large trucking firms engage in long-term contracts with industrial and manufacturing concerns, small trucking concerns and owner-operated trucks ply their wares in the overland spot market – a critical if little known market where everything from one-off shipping jobs to irregular freight to last-minute changes (for example, switching from rail to truck) take place.
Lockdowns, stay-at-home orders, and border crossing restrictions inflicted an extinction-level event on small trucking interests, with over 3,100 US trucking fleets shutting down last year, and 88,000 truckers losing their jobs in April of 2020 alone. That, amid rising gas prices, higher insurance premia, and chronic understaffing, has pushed freight rates up over 36 percent year-over-year.
I just want to add here, as I finish my remarks, that I am very concerned about the US administration’s seeming insistence upon hindering, if not outright stopping, the $455 billion of US-Canada trade that travels on the backs of trucks annually.
There are a handful of takeaways here, mostly obvious. The first is that the consequences of a false dichotomy – that policymakers had to choose between public health or functional economies – are not only still around twenty months later, but are in some cases worsening. The second is that as economists, in our role as educators and public intellectuals, we need to do a much better job conveying and emphasizing an organic, rather than mechanistic conception of our economies. They are more like a coordinated, globally-dispersed ballet recital than a system of hydraulics or pulleys.
And finally, the closest I can find to a silver lining in this post-pandemic disarray: Many of the ossified corners and dark underbellies of our economies are being exposed for the first time. They make good case studies, but serve better as calls to action. Now, and not when the Pi, Rho, Sigma, or Tau variants come along, is the time for social scientists to advise: ameliorating the snags and adverse consequences of policy when and where we can.
Thank you, and thanks for your time.
Related Posts

Operation Chokepoint 2.0: The Crypto Crackdown Explained (Video)
In this episode of Liberty Curious, Kate Wand discusses the Obama-era Operation Chokepoint, and today’s “Operation Chokepoint 2.0” with AIER Senior Research Faculty Thomas Hogan. Tom explains how government regulators […]

Earth Day, Waste and Productive Complements
It has been just over half a century since the first Earth Day in 1970. Over that time, April 22 has turned into a day with lots of waste cleanup […]

Focusing Exclusively on “Creating Jobs” Can Do More Harm Than Good
We are constantly bombarded by politicians declaring the importance of “creating jobs” in the economy. We regularly see government initiatives like public works projects, “stimulus” programs, and government subsidies enacted […]