
Sales of light vehicles totaled 14.3 million at an annual rate in April, up from a 13.4 million pace in March. The April result was a 6.6 percent increase from the prior month but was the eleventh consecutive month below the 16 to 18 million range, averaging just 13.7 million over that period (see first chart). Weak auto sales are largely a result of component shortages that have limited production, resulting in plunging inventory and surging prices.
Breaking down sales by origin of assembly, sales of domestic vehicles increased to 11.4 million units versus 10.5 million in March, a rise of 8.3 percent, while imports rose to 2.92 million versus 2.91 million in March, a gain of just 0.2 percent. Domestic sales had generally been in the 13 million to 14 million range in the period before the pandemic, averaging 13.3 million for the six years through December 2019. The domestic share came in at 79.6 percent in April versus 78.3 in March.
Domestic assemblies rose in March, coming in at 9.75 million at a seasonally adjusted annual rate. That is up 13.9 percent from 8.57 million in February but still well below the 11.2 million average pace for the six years through December 2019 (see first chart).

Component shortages, especially of computer chips, continue to restrain production for most manufacturers, creating a scarcity for many models, leading to lower inventory and higher prices. Ward’s estimate of unit auto inventory came in at 116,500 in March, up from 106,800 in February but still near the all-time low (see second chart). Inventory may be stabilizing as the average over the last seven months was 110,358 and has not dropped below 100,000. The Bureau of Economic Analysis estimates the inventory-to-sales ratio rose to 0.470 in March, up from a record low 0.362 in February (see second chart).
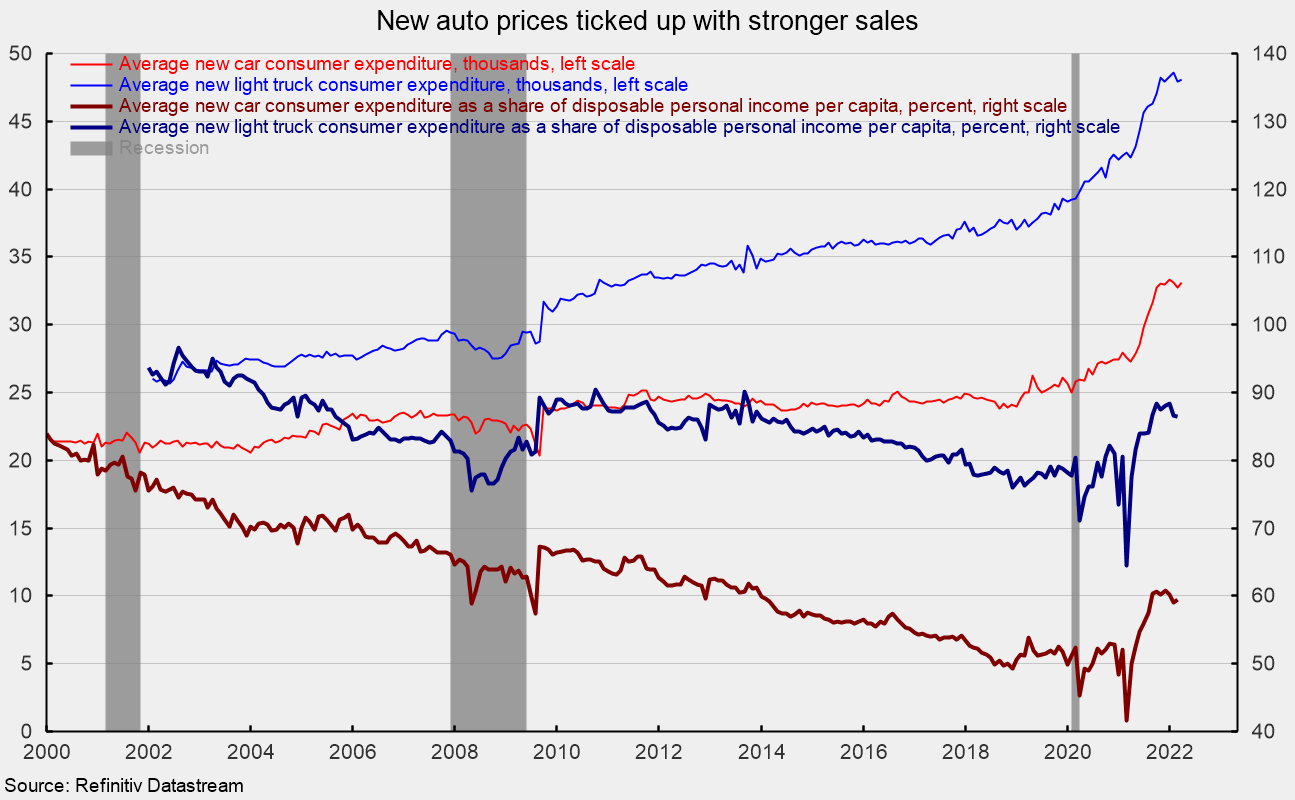
The plunging inventory levels have pushed prices sharply higher over the last two years. However, prices may be stabilizing with the average consumer expenditure for a car coming in at $33,117 in March, up 1.2 percent from February, but still below the recent high of $33,348 in December 2021 (see third chart). The average consumer expenditure on a light truck rose to $48,089 from $47,960 in February, up 0.3 percent for the month but below the $48,634 high in January 2022 (see third chart). Still, the March levels represent 12-month gains of 21.4 percent and 13.7 percent, respectively.
As a share of disposable personal income per capita, average consumer expenditures on a car came in at 59.5 percent versus 59.1 in February but up sharply from 41.6 percent in March 2021. The average consumer expenditure on a light truck as a share of disposable personal income per capita was 86.4 percent versus 86.6 percent in February but 64.5 percent in March 2021 (see third chart). Both measures are about equal to the 2014 percentages.
Related Posts

Operation Chokepoint 2.0: The Crypto Crackdown Explained (Video)
In this episode of Liberty Curious, Kate Wand discusses the Obama-era Operation Chokepoint, and today’s “Operation Chokepoint 2.0” with AIER Senior Research Faculty Thomas Hogan. Tom explains how government regulators […]

Earth Day, Waste and Productive Complements
It has been just over half a century since the first Earth Day in 1970. Over that time, April 22 has turned into a day with lots of waste cleanup […]
Focusing Exclusively on “Creating Jobs” Can Do More Harm Than Good
We are constantly bombarded by politicians declaring the importance of “creating jobs” in the economy. We regularly see government initiatives like public works projects, “stimulus” programs, and government subsidies enacted […]