
Sales of light vehicles totaled 12.9 million at an annual rate in November, down slightly from a 13.0 million pace in October. The November result was the sixth consecutive month below the 16 to 18 million range, matching the six-month span from March through August 2020 (see first chart). Sales are about 25 percent below the five-year average rate of 17.2 million through December 2019. Weak auto sales is largely a result of component shortages that have limited production, resulting in plunging inventory and surging prices.
Breaking down sales by origin of assembly, sales of domestic vehicles increased to 10.4 million units versus 10.2 million in October, a rise of 1.8 percent, while imports fell to 2.51 million versus 2.79 million in October, a drop of 10.0 percent. Domestic sales had generally been in the 13 million to 14 million range in the period before the pandemic, averaging 13.4 million for the five years through December 2019. The domestic share came in at 80.5 percent in November versus 78.5 in October and the highest share since November 2014.
On a positive note, domestic assemblies increased in October, coming in at 8.8 million at a seasonally adjusted annual rate. That is up from 7.4 million in September, but still well below the 11.2 million pace for the five years through December 2019 (see first chart).
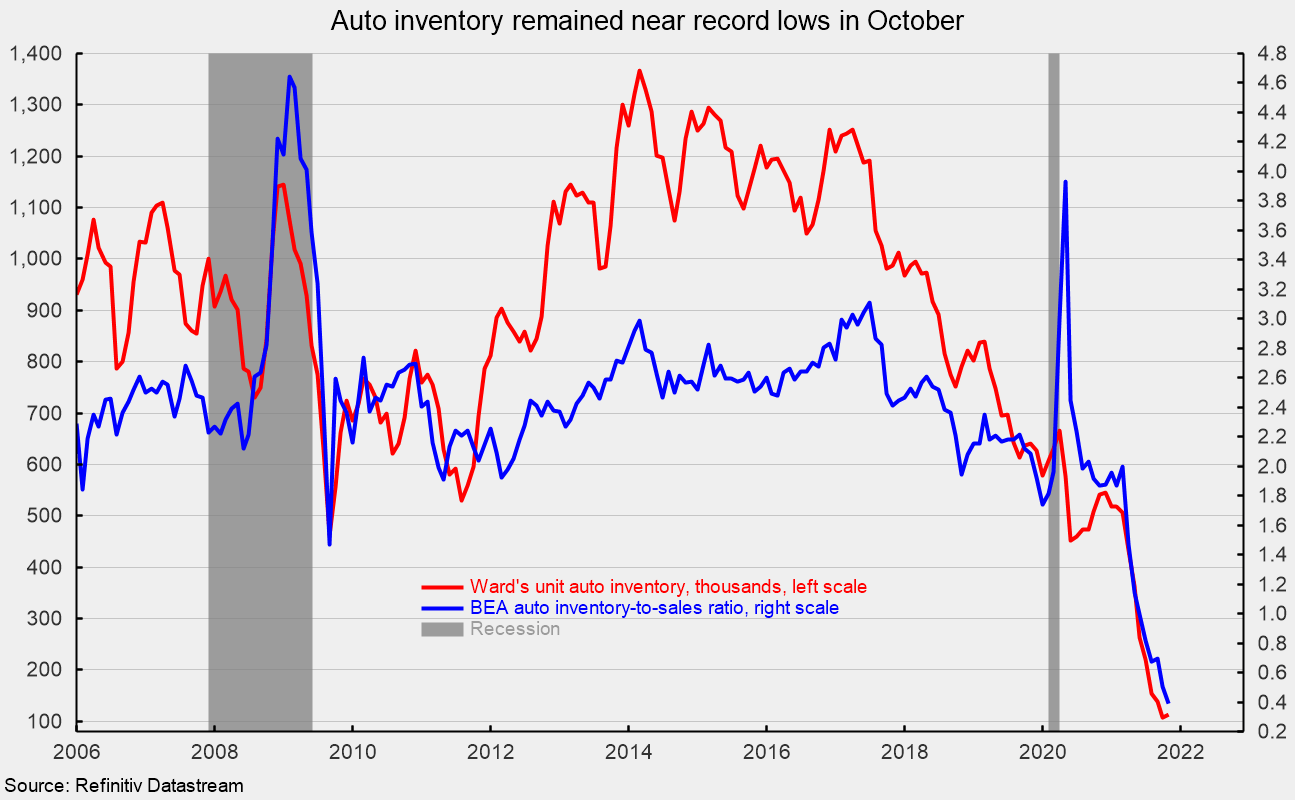
Despite the improved output, component shortages, especially computer chips, continue to disrupt production for most manufacturers, creating a scarcity for many models, leading to lower inventory and higher prices. Ward’s estimate of unit auto inventory came in at 114,100 in October, the second lowest on record (see second chart). The Bureau of Economic Analysis estimates the inventory-to-sales ratio was a record low 0.389 in October (see second chart).
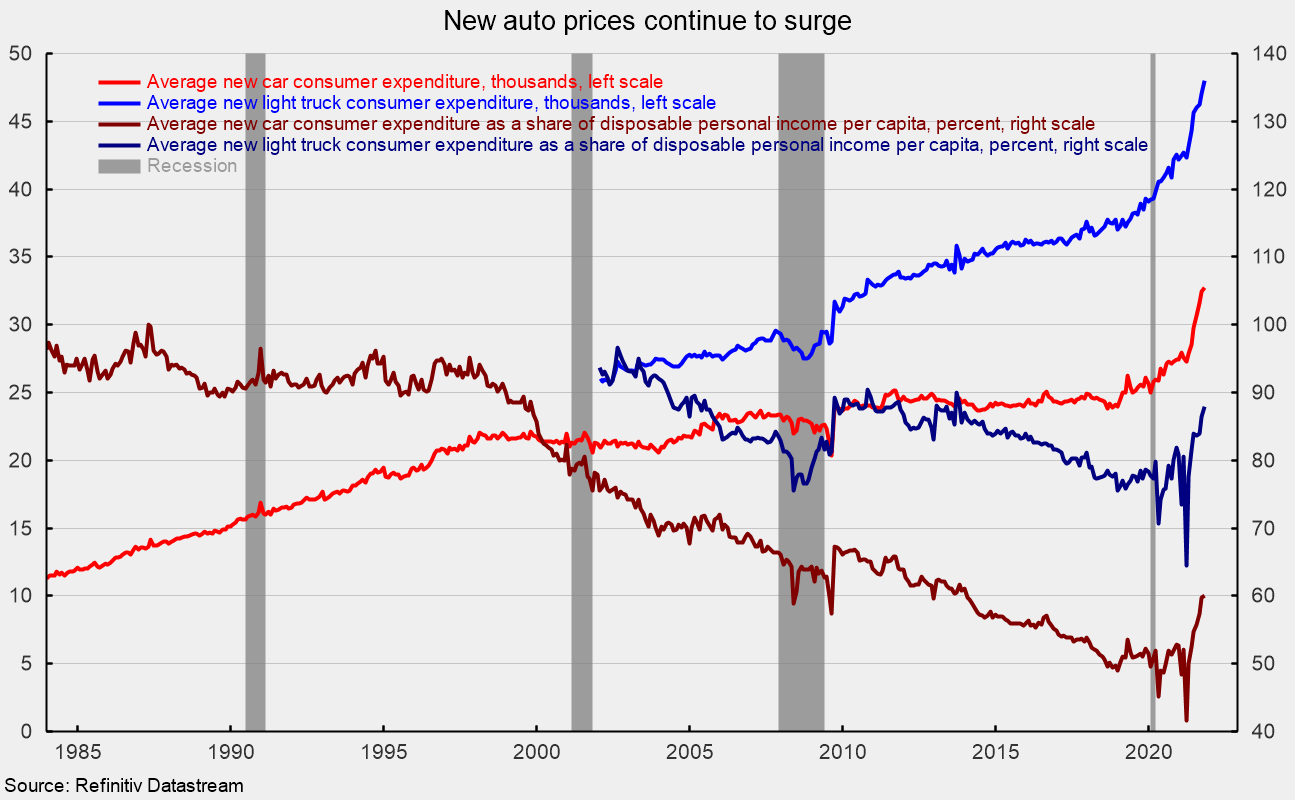
The plunging inventory levels continue to push prices higher. The average consumer expenditure for a car was $32,747 in October while the average consumer expenditure on a light truck rose to $48,013 (see third chart). The October levels represent 12-month gains of 20.0 percent and 13.8 percent, respectively.
As a share of disposable personal income per capita, average consumer expenditures on a car came in at 60.0 percent versus just 41.6 percent in March 2021 while the average consumer expenditure on a light truck as a share of disposable personal income per capita was 88.0 percent versus 64.5 percent as recently as March 2021 (see third chart).
Related Posts

Operation Chokepoint 2.0: The Crypto Crackdown Explained (Video)
In this episode of Liberty Curious, Kate Wand discusses the Obama-era Operation Chokepoint, and today’s “Operation Chokepoint 2.0” with AIER Senior Research Faculty Thomas Hogan. Tom explains how government regulators […]

Earth Day, Waste and Productive Complements
It has been just over half a century since the first Earth Day in 1970. Over that time, April 22 has turned into a day with lots of waste cleanup […]

Focusing Exclusively on “Creating Jobs” Can Do More Harm Than Good
We are constantly bombarded by politicians declaring the importance of “creating jobs” in the economy. We regularly see government initiatives like public works projects, “stimulus” programs, and government subsidies enacted […]