
On January 6th, Phil Gramm and John Early published a provocative op-ed in The Wall Street Journal titled, “Upward Mobility is Alive and Well in America.” The pair make a good case. They show, for example, that for those born in the bottom quintile of income, 63 percent rose to a higher quintile by adulthood. In addition, 6 percent reached the highest quintile. The authors calculated the estimates by averaging the outcomes of three well-regarded economic studies across different time frames.
Despite the good news, I fear the authors are a bit too sanguine, but not for the usual reasons. With a bit of rhetorical bombast, they suggest “collectivists” are the only ones left to claim that the American Dream is “in peril.” In fact, any student and advocate of free markets should have great concern today about the enormous difficulty of rising out of low-income situations, with challenges that did not exist decades ago. Ironically, the problem began in 1965, when many social welfare programs were put into place as part of President Johnson’s “War on Poverty.”
Most of the research around the unintended negative consequences of these programs focuses on the issue of benefits cliffs. A benefits cliff is a sudden drop-off of benefits at a certain income threshold, such as a sudden ending of childcare benefits. Benefits cliffs make for good stories to illustrate the negative impact on work incentives, as they are both visually and emotionally dramatic.
But there is a more subtle problem around how these welfare programs are constructed, and it’s far more insidious to upward economic mobility. Let’s take a closer look. When a person enrolls in a social safety net program, he cannot stay on it forever, regardless of salary increases. Otherwise the program would be prohibitively expensive to taxpayers. This means the benefit must roll back at some rate as income increases. A benefit reduction rate (BRR) is the rate at which benefits decrease for every dollar earned. For example, suppose SNAP (food stamp) benefits decrease by 24 cents for every 1 dollar a recipient earns. This is equivalent to a 24 percent income tax. Now suppose we add in a childcare benefit, which decreases in dollar value by 10 cents per dollar earned. Add the two BRRs together, and this acts just like a 34 percent tax on every dollar earned. Add in a 7.65 percent payroll tax and now we are up to a 41.65 percent tax on income.
This overall total (in this example, 41.65 percent) is known as an effective marginal tax rate, or EMTR. For a household receiving many social welfare benefits, the EMTR can easily land between 85 and 105 percent. Note this has nothing to do with benefits cliffs, which occur only at certain income thresholds. The high EMTR, on the other hand, is an ongoing penalty for every dollar earned, across long spans of income before one hits the cliff.
Consider a hardworking individual working full-time, earning $10 an hour, and facing an 85 percent EMTR. Here is the brutal truth: An additional hour of work will yield not $10, but just $1.50, on net. Put into perspective, the minimum wage in 1968 was $1.60.
In a 2021 article published in The Journal of Poverty with co-author Zach Blizard, I coined the term a “disincentive desert,” the insidious impact where one’s work barely pays off. In the past year, the term is gaining traction in newly published research. Some other researchers call this effect a “benefits plateau” but this term sounds almost cozily benign and gives the wrong impression. Benefits are not plateauing, they are decreasing with income.
Economist Ed Dolan uses our disincentive desert concept in a recent article to illustrate a compelling scenario. Consider the Figure 1 below, which shows earned income versus the net household income for a family living in Boston. If there were no taxes or social welfare benefits, one would progress up the dotted 45 degree line. That is, income is equal to net household income and a dollar earned is a dollar received, no more and no less.
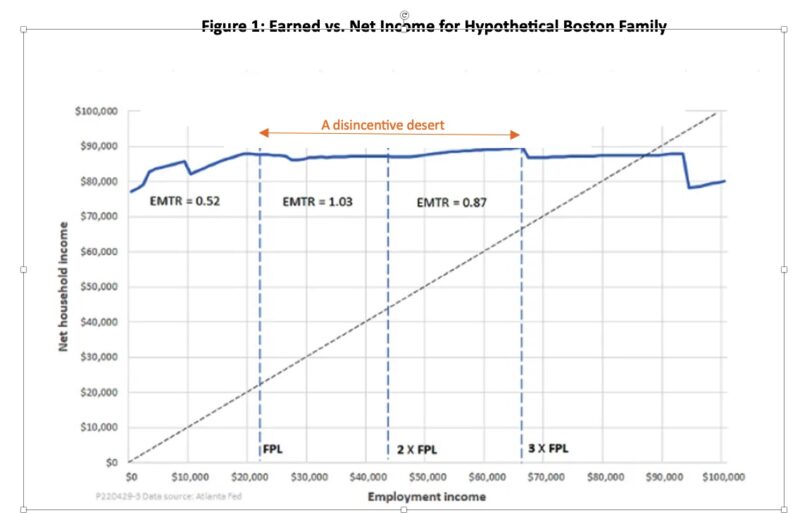
But in Dolan’s scenario, look at a three-person household earning $22,000, which is the official federal poverty level. At this salary, the sum of the income plus the eligible benefits is around $88,000 (indicating $66,000 in benefits!). Now suppose a second person gets a job and the family sees their income double, to $44,000. Now earning twice the poverty rate, the net household income (including benefits) actually falls slightly behind. This is because the EMTR is 103 percent over that range. In other words, for every $1 the household earns between $22,000 and $44,000, its total wages and benefits fall by $1.03.
It gets only marginally better as the household income moves towards three times the official poverty level, or $66,000, as seen in Figure 1 again. From $44,000 to $66,000, the family faces an EMTR on work dollars of 87 percent, receiving 13 cents in net household income for every dollar earned.
The overall picture is grim, a reflection of a system that provides scant return on the fruit of one’s labor. The journey between a household income of $22,000 and an income of $66,000 (think education, training, promotions, learned skill sets) yields only five cents on the dollar on average, or a 95 percent EMTR. In other words, a $40,000 raise yields just a $2,000 net improvement in total wages and benefits.
The disincentive desert, which we have previously defined as an EMTR that lies between 85 and 110 percent, is a long and harsh journey for those who choose to take the path. Notice in Figure 1 that the first big benefits cliff in Dolan’s scenario does not occur until there is a household income of approximately $94,000, hardly a probable future outcome facing most low-income families. Some analysts incorrectly argue that benefits cliffs are not really a problem, since relatively few people are near the income threshold of the benefits cliff. They miss the bigger point about incentives, or lack thereof.
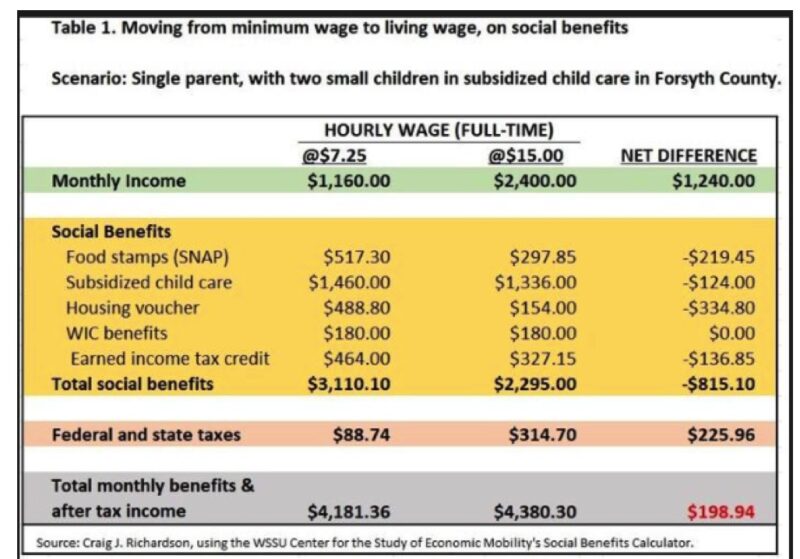
We need to remember that rational decision-makers would never cross a desert, only to fall off a cliff at the desert’s far edge. Solutions to improve upward economic mobility must revolve around creative economic policies and private sector solutions that mitigate disincentive deserts, to boost hope and strengthen our economy’s rebound. The Center for the Study of Economic Mobility (CSEM) is now using a social benefits calculator that was created for Forsyth County, NC to allow employees, employers and others to investigate how two different wage levels impact the social welfare benefits and their overall net position. It uses a 5-minute, simple-to-understand questionnaire, which is useful for the everyday person or firm intent on navigating the social safety net thicket. (The Georgia Center for Opportunity provides an alternative, deeper dive into the subject, with a sophisticated calculator, graphs, and tables of data across multiple states and counties.)
Using the CSEM calculator, an example is provided below of a single mother with two children receiving a host of benefits in Table 1. As seen, raising the minimum wage from $7.25 an hour to $15.00 an hour does little to help her. Despite monthly income for a full-time worker rising by $1,240, only $199 is captured on net, after the benefit rollbacks and tax increases. Thus, a 106 percent pay raise melts away to a mere 16 percent increase in the household’s overall finances.
There are ways to avoid these traps, including employers thinking innovatively about a menu of different options for their employees that don’t rely solely on wage increases. Augmented or alternative options for raising their workers’ standard of living could include on-site childcare or travel vouchers.
In sum, benefits cliffs certainly remain an important area of policy study, but we should pay more attention to creatively solving the problems of disincentive deserts, since they exist for such long and dispiriting spans of workers’ income journey. That’s certainly better than collective handwringing at the frustrating and unintended consequences of programs meant to help those at the bottom of the economic ladder.
Related Posts

Operation Chokepoint 2.0: The Crypto Crackdown Explained (Video)
In this episode of Liberty Curious, Kate Wand discusses the Obama-era Operation Chokepoint, and today’s “Operation Chokepoint 2.0” with AIER Senior Research Faculty Thomas Hogan. Tom explains how government regulators […]

Earth Day, Waste and Productive Complements
It has been just over half a century since the first Earth Day in 1970. Over that time, April 22 has turned into a day with lots of waste cleanup […]

Focusing Exclusively on “Creating Jobs” Can Do More Harm Than Good
We are constantly bombarded by politicians declaring the importance of “creating jobs” in the economy. We regularly see government initiatives like public works projects, “stimulus” programs, and government subsidies enacted […]