
The AIER Leading Indicator remained essentially neutral in February 2023, maintaining the level of 58 from the previous month. Our Roughly Coincident Indicator rose from 50 to 92 in February 2023, with the Lagging Indicator falling from 50 to 33.
Over the past year, the Leading Indicator has declined from generally neutral levels to a preponderance of contractionary indications (below 50) between July and December 2022. This coincides with a US economic landscape characterized by the highest inflation in two generations, a historically aggressive monetary policy response, and a brief recession followed by a tepid recovery. In January and February 2023, the index again rose above 50, but only marginally. The current reading is best characterized as a return to the generally neutral levels that prevailed between August 2021 and June 2022 (with a slight spike to 63 in January 2022).
While the Roughly Coincident Index rose from a neutral 50 in January 2023 to a broadly expansive level of 92 in February, clarification is required. Of its six constituents, five were positive, indicating a broad positive trend. But among those five, four increased by less than .20% above the neutral range from January to February 2023. Thus while constituting an expansion per the rules of the diffusion index’s construction, the actual economic significance of those increases is likely less remarkable than the consequent index number (92) suggests. The Roughly Coincident Indicator has, over the last year, oscillated between moderately and broadly expansive readings with the exception of a January 2023 dip to the neutral (50) level.
The Lagging Indicators continued a downward trend which began in January 2023. After spending ten of the last twelve months at a level of 83 with a slight decline to 67 in September 2022, the new year has seen the constituents of the index fall first to a neutral 50, and now to 33. Here too, as in the case of the coincident readings, two of the four components registered changes only marginally below the neutral threshold but constituting an overall downtrend nevertheless.
In all, ten of the twenty-four measures composing the three indices within the Business Conditions Monthly for February 2023 showed month-to-month changes one half of one percent outside the neutral range. This is likely a continuation of the “churn” that resulted in the overwhelmingly neutral Leading (58), Coincident (50), and Lagging (50) readings last month. While the Roughly Coincident indicator suggests a broad uptrend, the actual quantitative internals of that component considered in light of the Leading and Lagging Indicators as well as the backdrop of continued economic uncertainty suggest continued neutrality in the broad economic outlook.
Leading Indicators (58)
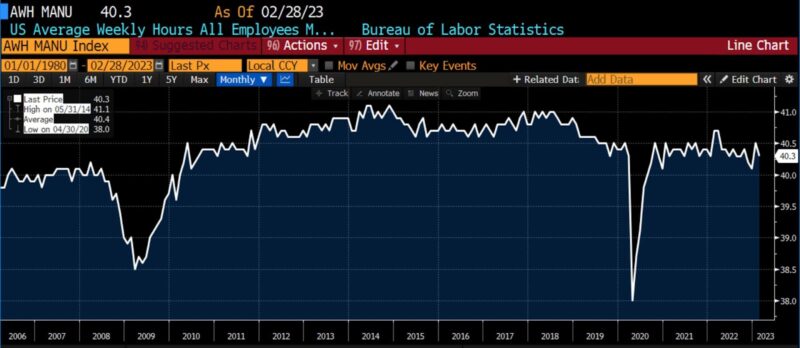
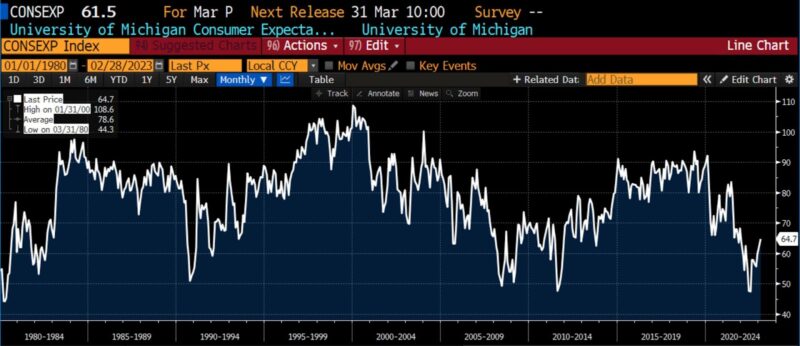
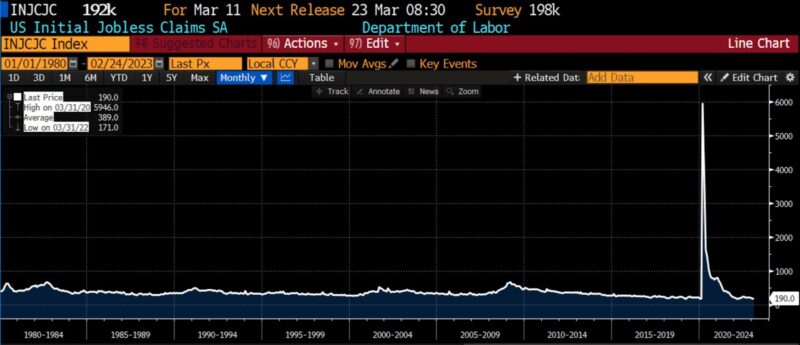
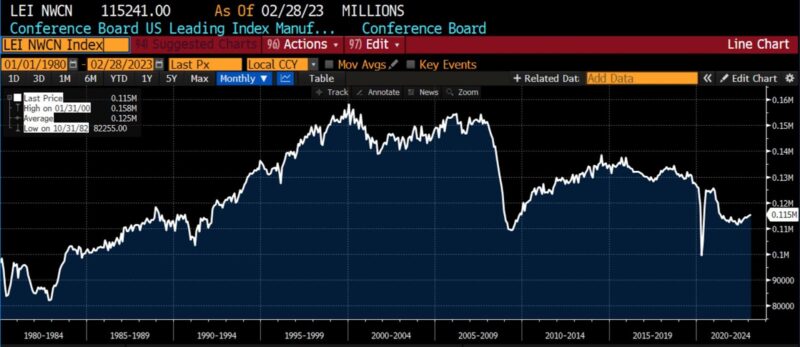
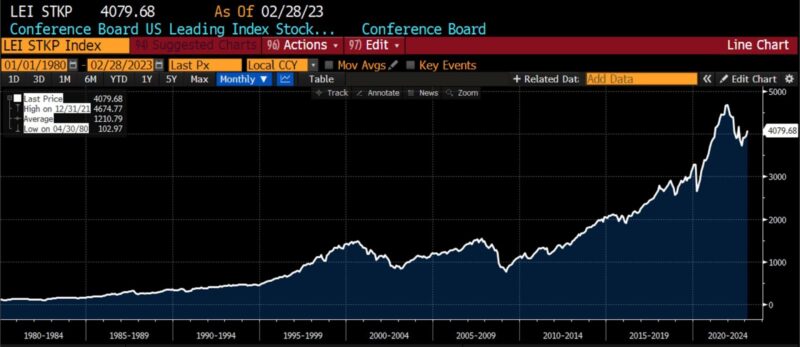
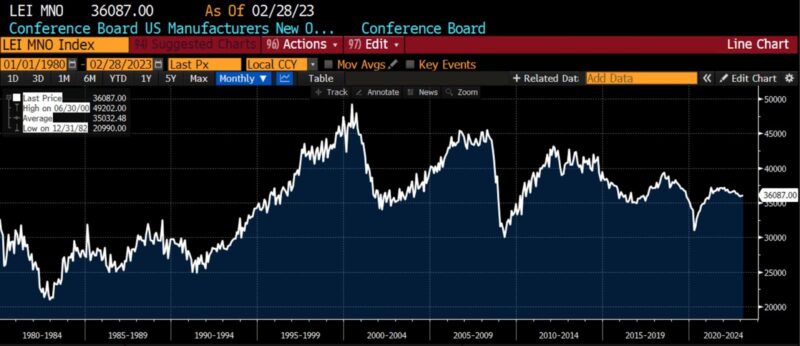
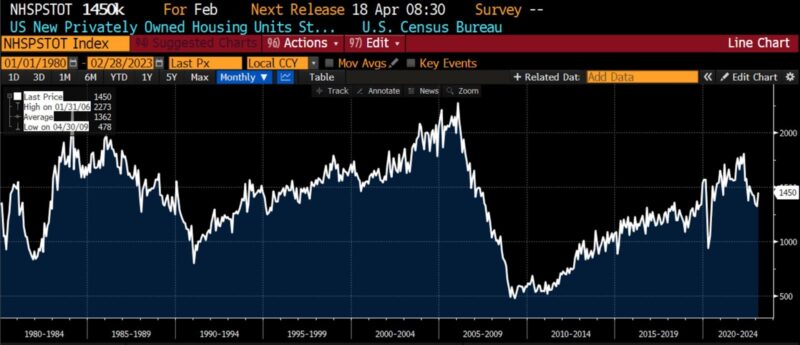
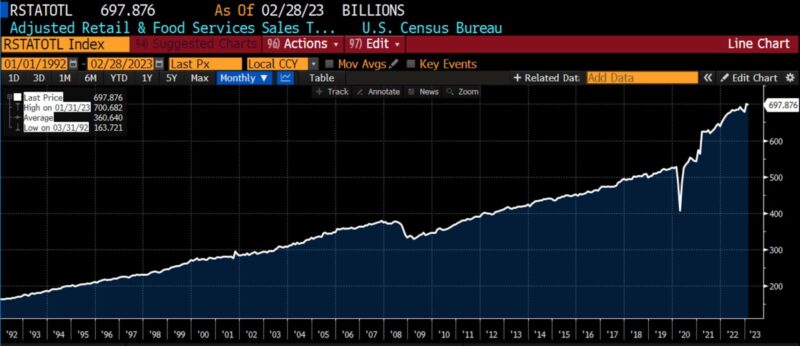
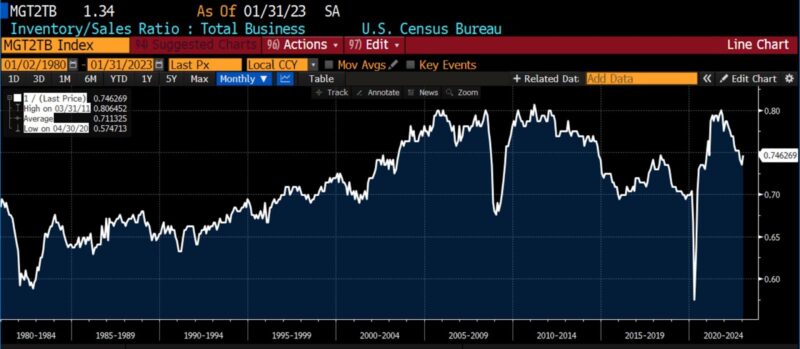
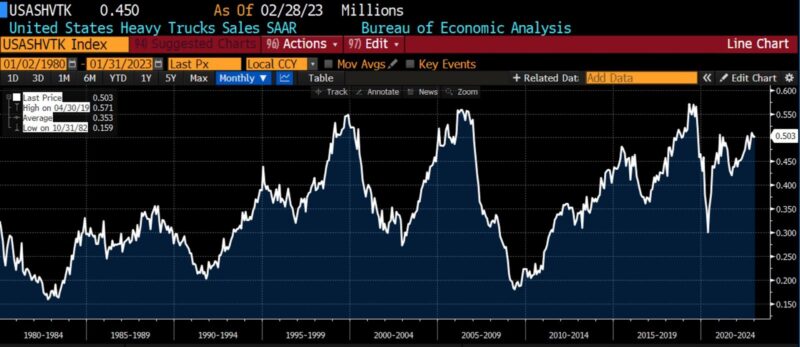
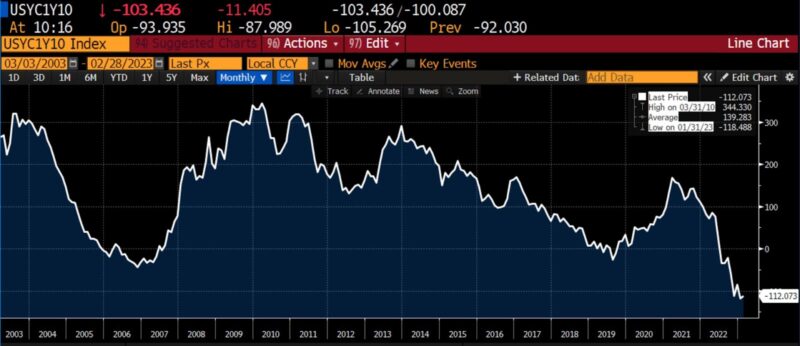
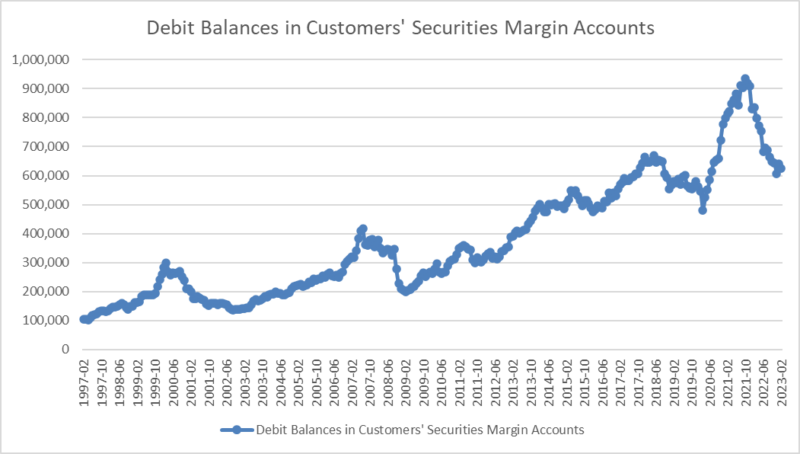
Three economic indicators registered significant moves among the leading indicators in February. US heavy truck sales fell by over 10 percent month-to-month, bringing the decline in that index from the start of 2023 to 11 percent. On the upside, private new housing starts rose by over 9 percent and the 1-to-10 year US Treasury yield spread tightened by 5 percent, albeit within the context of a steeply inverted US Treasury yield curve. Among the twelve constituents of the Leading Indicator Index seven rose and five declined between January and February 2023. In addition to private new housing starts and the 1-to-10 year US Treasury yield spread, the University of Michigan Consumer Expectations Index, the inventory/sales ratio, the three Confidence Board indices (the Leading Index of Stock Prices, the Leading Index of Manufacturers New Orders, and the Manufacturers of New Orders of Nondefense Capital Goods, etc.) all rose in February 2023. Falling in addition to US heavy truck unit sales were initial jobless claims, US average weekly hours worked (all employees), adjusted retail & food service sales, and debit balances in brokerage margin accounts.
Coincident (92) & Lagging Indicators (33)
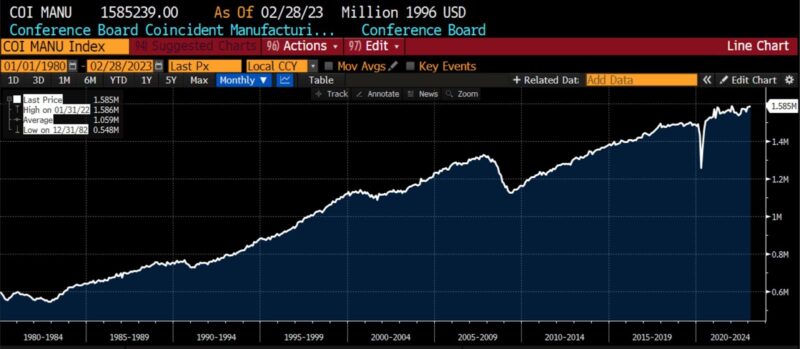
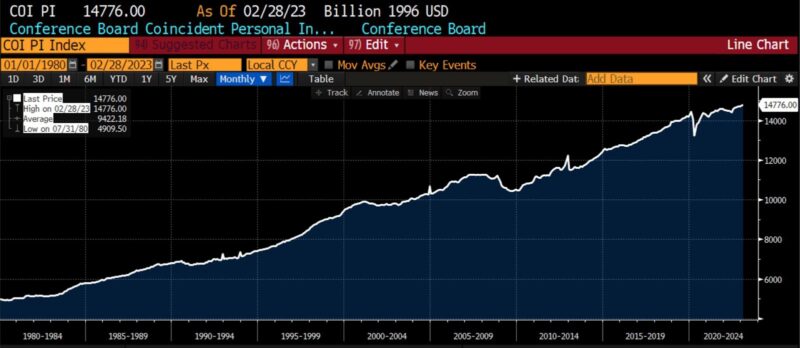
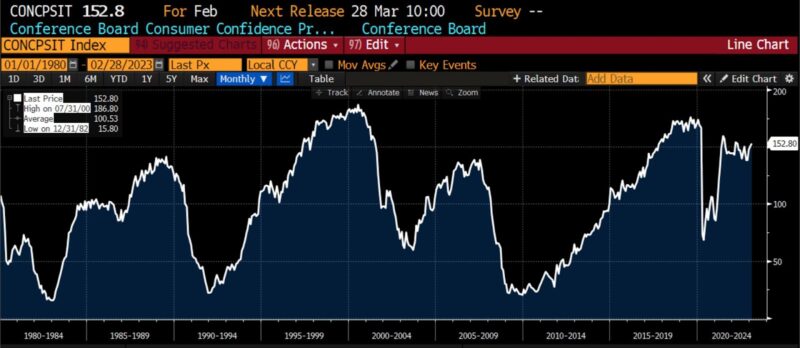
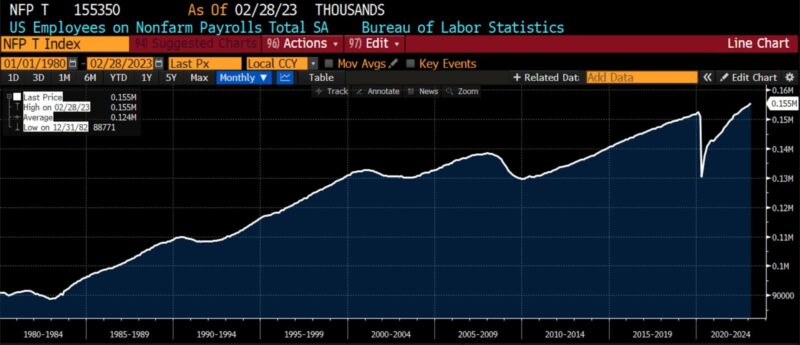
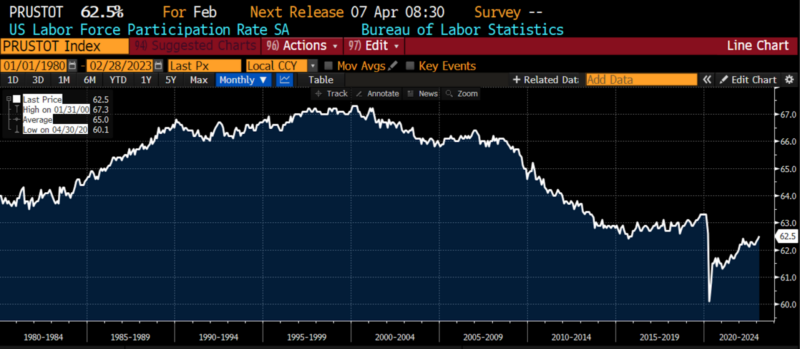
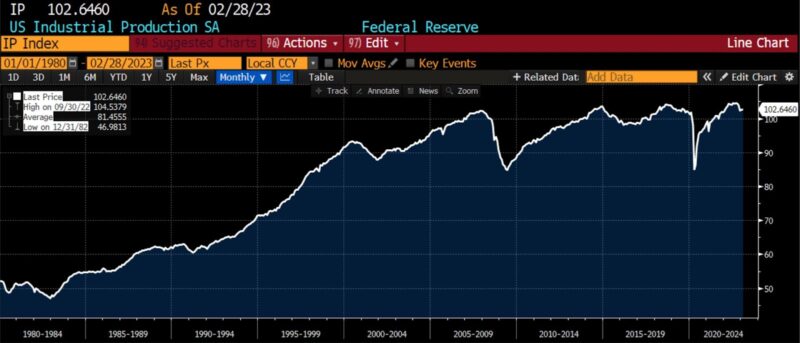
Five of the six Coincident Indicators increased from January to February 2023. The three Confidence Board indices in this category (Consumer Confidence Present Situation, Coincident Personal Income Less Transfer Payments, and Coincident Manufacturing and Trade Sales) were all higher, as were US labor force participation rate and US employment (non-farm payrolls). US Industrial Production, however, was essentially flat for the first two months of 2023. As mentioned previously, though, while those five components were higher in February than they were in January, four of them were less than 0.20 percent higher than the neutral threshold. Thus while the 92 level is correct in terms of index calculation, it is somewhat unrepresentative of the tenor of roughly coincident US economic activity in February 2023.
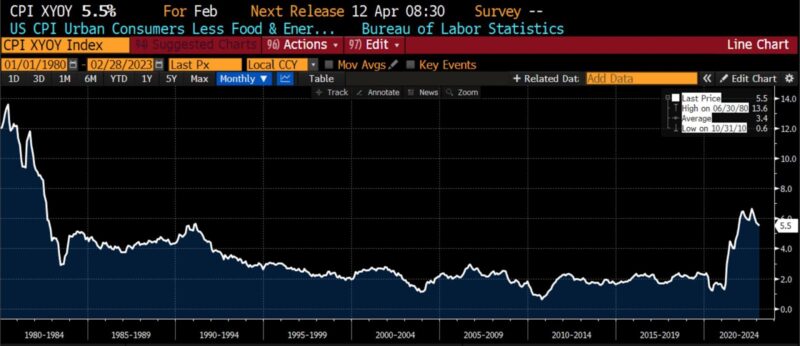
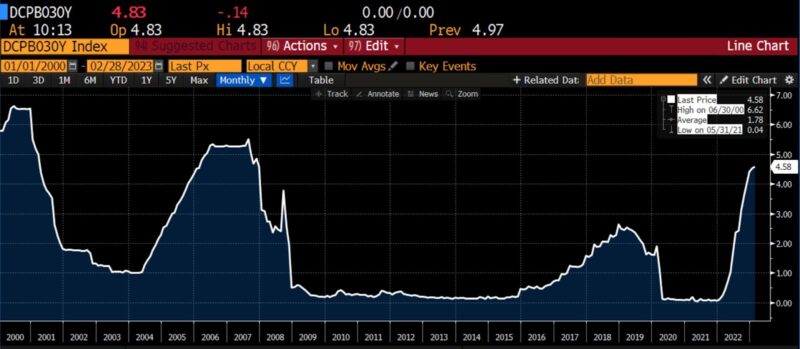
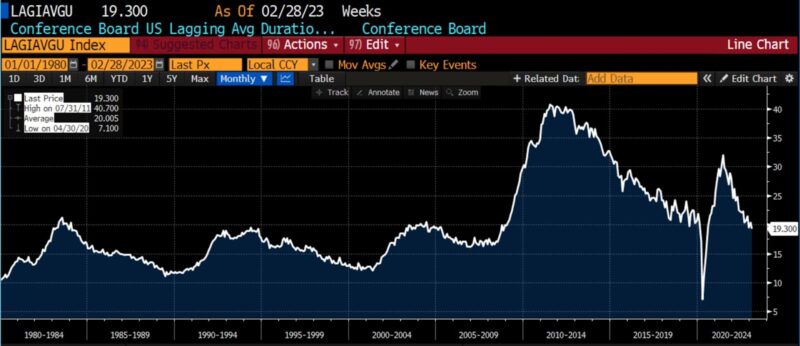
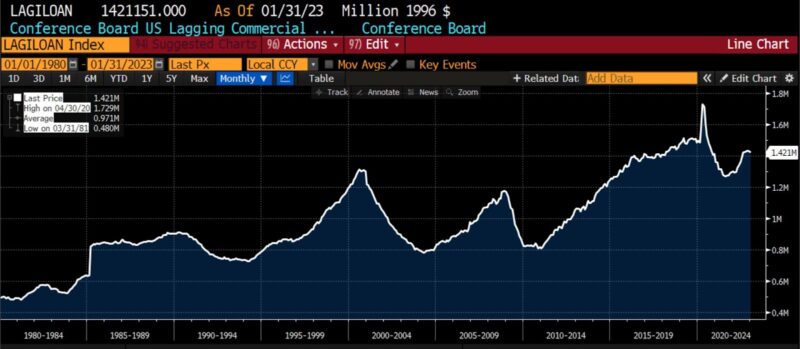
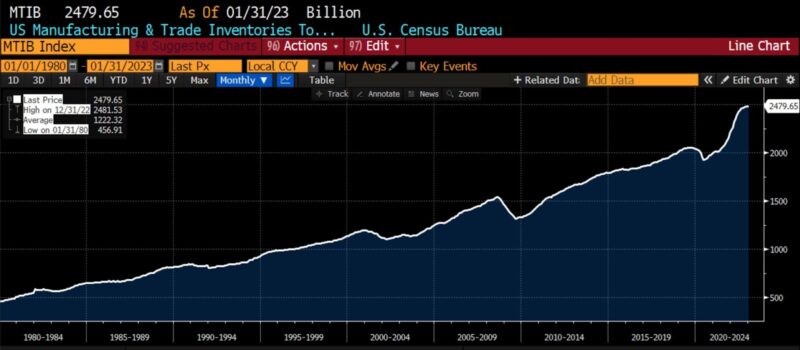
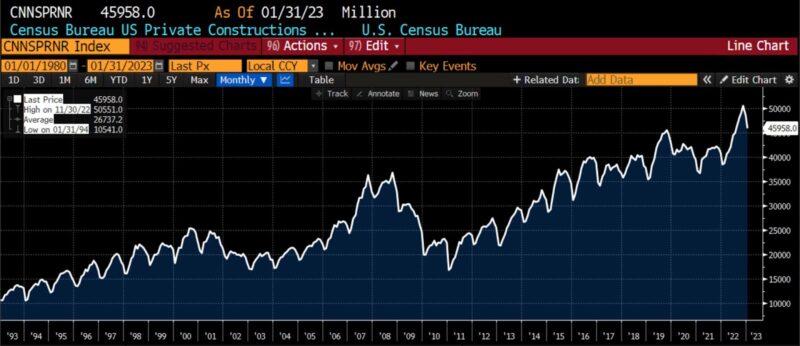
AIER’s Lagging Indicators saw its January 2023 neutral bias shift to a negative trend, with four of the six measures within it declining. The US Census Bureau’s Private Construction Spending on Nonresidential Structures, January 2023 headline CPI (year-over-year), manufacturing and trade inventories, and the Conference Board’s Lagging Commercial and Industrial Loans all declined. The Confidence Board’s US Lagging Average Duration of Unemployment and the yield on a composite of short-term interest rates rose. Unlike the internals of the Coincident Indicators, the components of the Lagging Indicators evidenced less ambiguity in their broad turn negative with the exception of the small pullback in the month-over-month change in US manufacturing and trade Inventories.
Taking into account the trivial changes within the Roughly Coincident Indicators Index, the overall sentiment relayed by the February 2023 Business Conditions Monthly is one of continued neutrality. The last time that the three current index levels, 58 (Leading), 92 (Roughly Coincident), and 33 (Lagging) were seen similarly configured was during a five month period between August and December of 2021 inclusive.
| Leading | Coincident | Lagging | |
| Aug-21 | 58 | 100 | 33 |
| Sep-21 | 54 | 92 | 25 |
| Oct-21 | 50 | 83 | 25 |
| Nov-21 | 50 | 75 | 33 |
| Dec-21 | 50 | 75 | 42 |
Throughout January and February 2023, it became evident that the disinflationary trend that had begun in the late summer and autumn of 2022 was losing momentum. Service prices continued to rise, and core inflation remained broadly elevated. Those factors, plus uncommon strength in both labor markets and retail consumption, have led to rising estimates of the Federal Reserve’s terminal policy rate. Consequently, speculation regarding what has been called the “most anticipated recession in US history” has increased. The inconclusive status of the US debt ceiling standoff provided an additional headwind on top of the downward revision of 4th quarter US GDP from 2.9 percent to 2.7 percent. Last but not least, the one year anniversary of the Russo-Ukrainian War on February 24th, alongside growing Chinese economic support for Russia, suggests a long, grim slog ahead. In addition to monetary and fiscal policy uncertainty, the increasing scope of the war in southern Europe has implications for energy prices, trade policy, and government spending. Uncertainty remains elevated, as does risk.
Errata: In the January 2023 Business Conditions Monthly an erroneous chart was shown. The Leading Indicator tracking sales/inventory trends was shown as the Institute for Supply Management’s Manufacturing Orders Inventories or Book Bill Ratio, when in fact the US Census Bureau’s Manufacturing and Trade Inventory/Sales Ratio is in use. Also, the chart of Debit Balances in Margin Accounts was displayed in reverse date order (most recent to the left). Corrections will appear on the AIER website.
LEADING INDICATORS (1980 – present where possible)
ROUGHLY COINCIDENT INDICATORS (1980 – present where possible)
LAGGING INDICATORS (1980 – present where possible)
CAPITAL MARKET PERFORMANCE
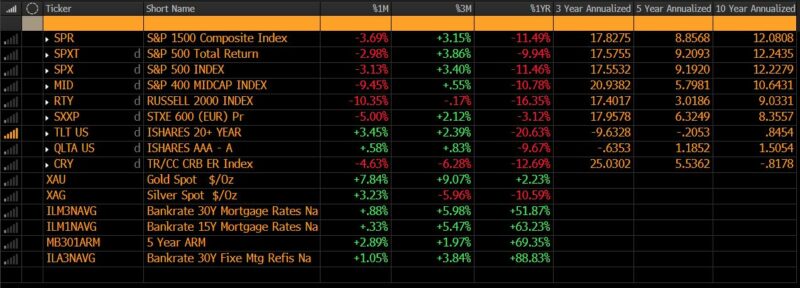
(All charts sourced via Bloomberg Finance, LP)
Related Posts

Operation Chokepoint 2.0: The Crypto Crackdown Explained (Video)
In this episode of Liberty Curious, Kate Wand discusses the Obama-era Operation Chokepoint, and today’s “Operation Chokepoint 2.0” with AIER Senior Research Faculty Thomas Hogan. Tom explains how government regulators […]

Earth Day, Waste and Productive Complements
It has been just over half a century since the first Earth Day in 1970. Over that time, April 22 has turned into a day with lots of waste cleanup […]

Focusing Exclusively on “Creating Jobs” Can Do More Harm Than Good
We are constantly bombarded by politicians declaring the importance of “creating jobs” in the economy. We regularly see government initiatives like public works projects, “stimulus” programs, and government subsidies enacted […]