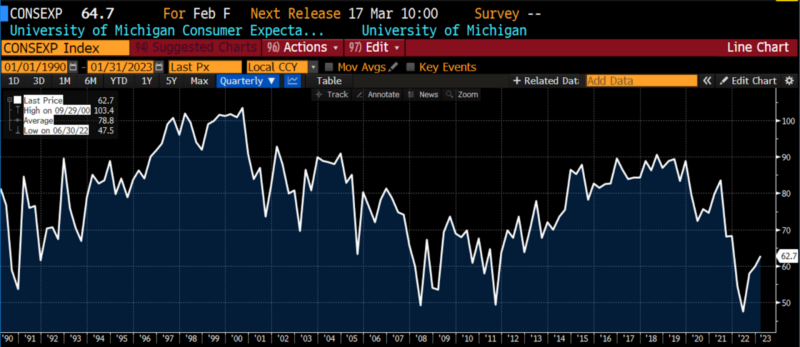
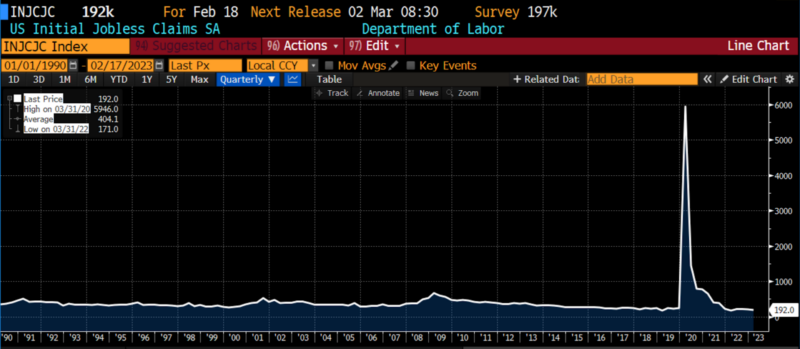
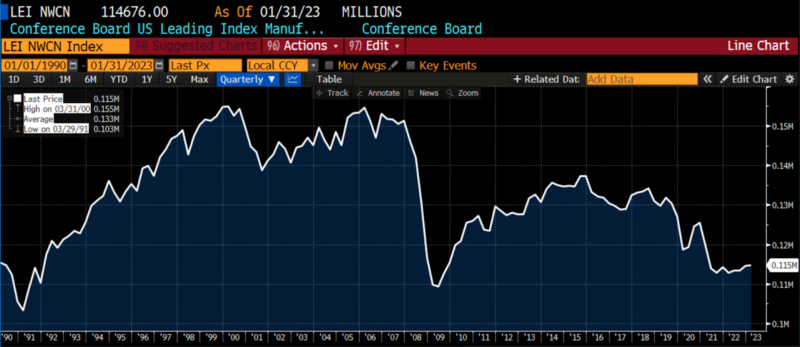
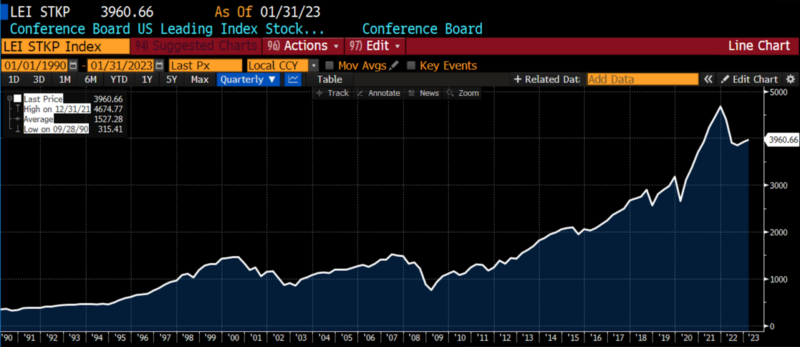
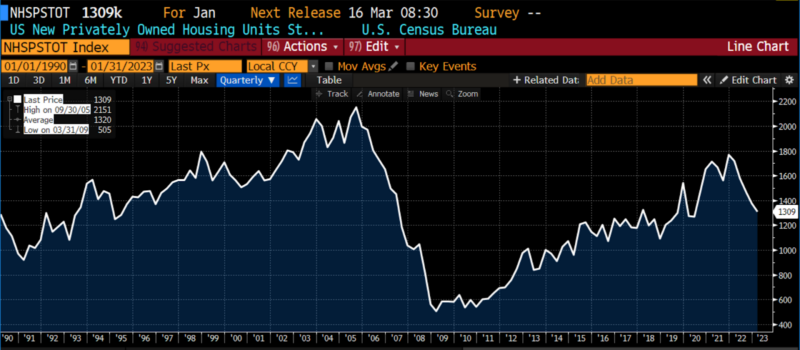
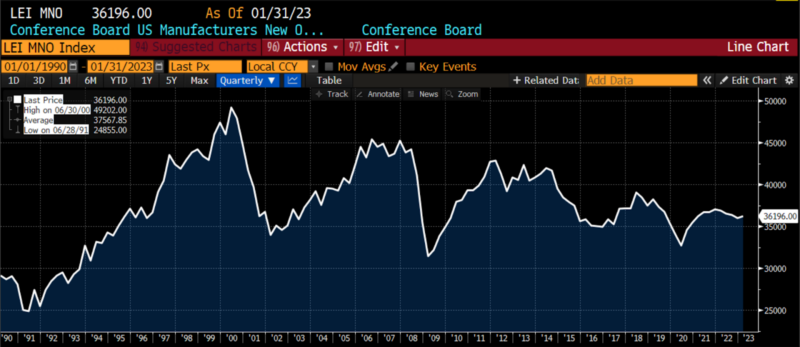
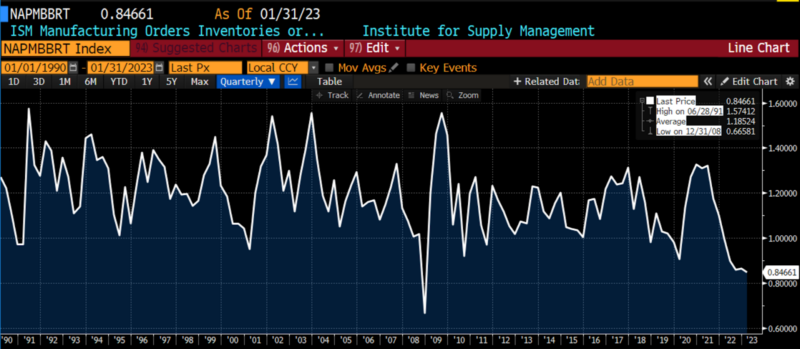
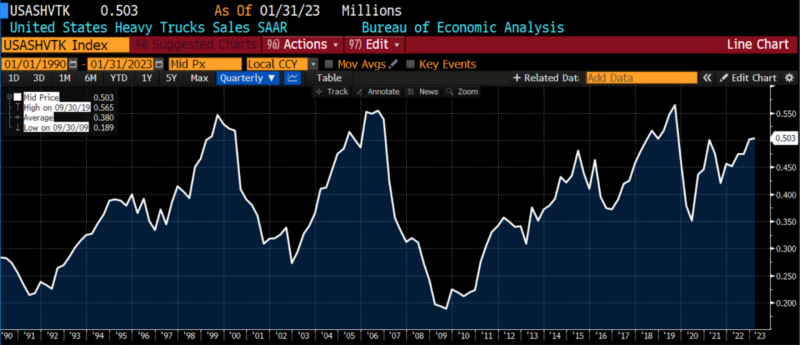
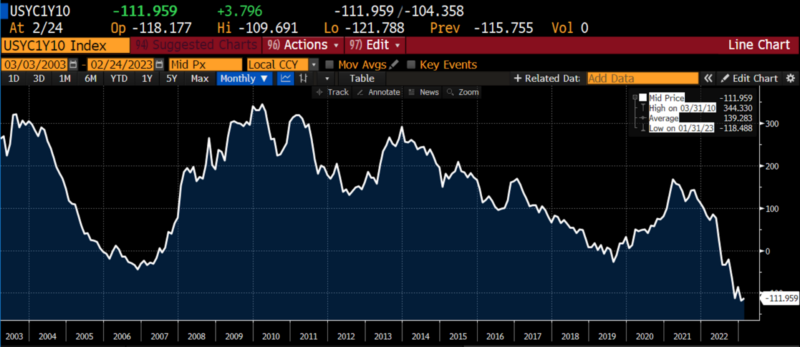
AIER Leading Indicators rose to 58 in January 2023 from 21 in December 2022, an increase to just over the neutral level of 50. This breaks a seven month trend below the neutral threshold. While numerically this signals business expansion, the internals of the twelve economic indicators were dominated by insubstantial month-to-month changes. Three economic indicators registered significant positive moves over December: initial jobless claims, debit balances in margin accounts, and the 10-year to 1-year US Treasury spread. Heavy truck unit sales fell substantially. With three components of the Leading Indicator index rising significantly, one falling significantly, and the remaining eight with small, insignificant changes over the previous month, the bias remains largely neutral.
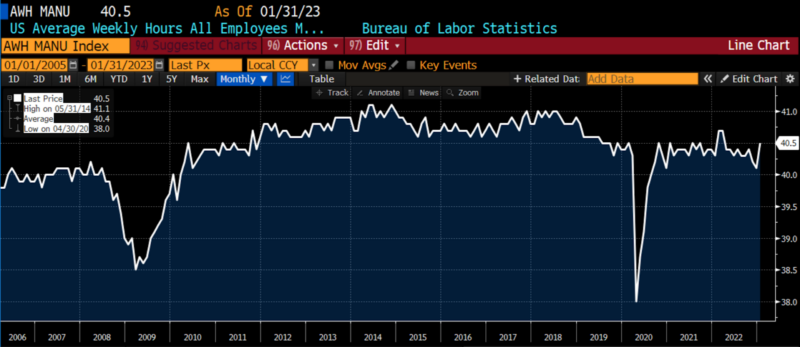
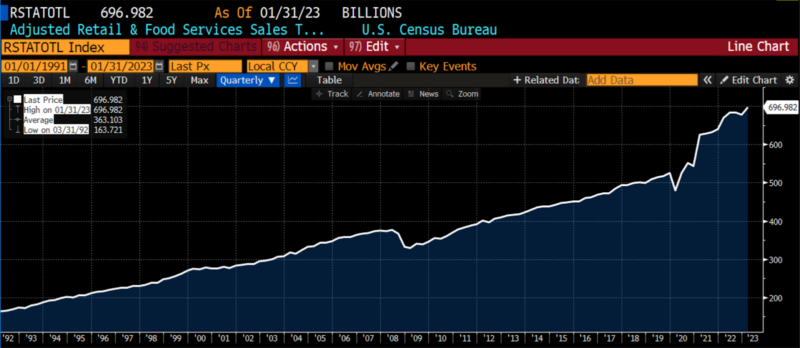
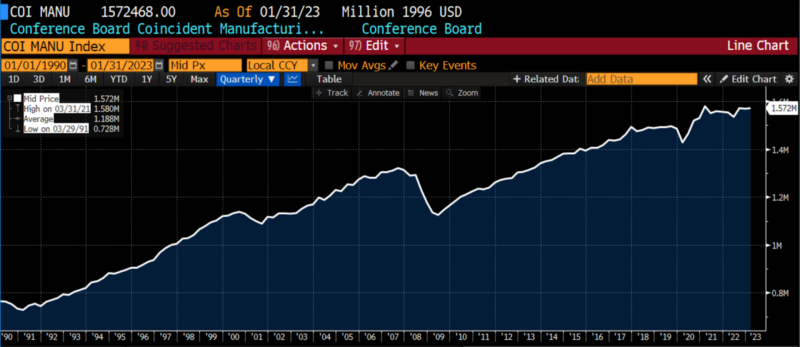
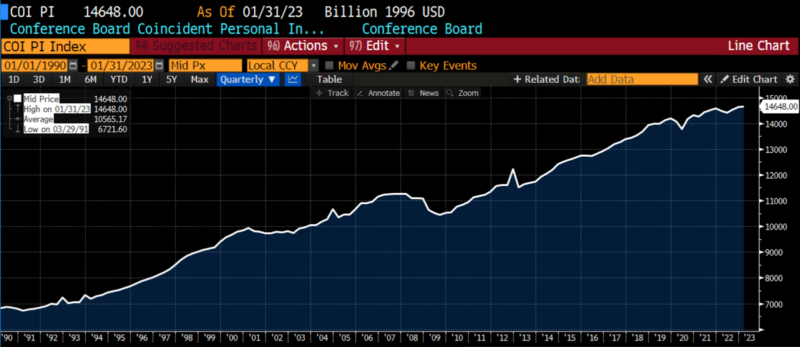
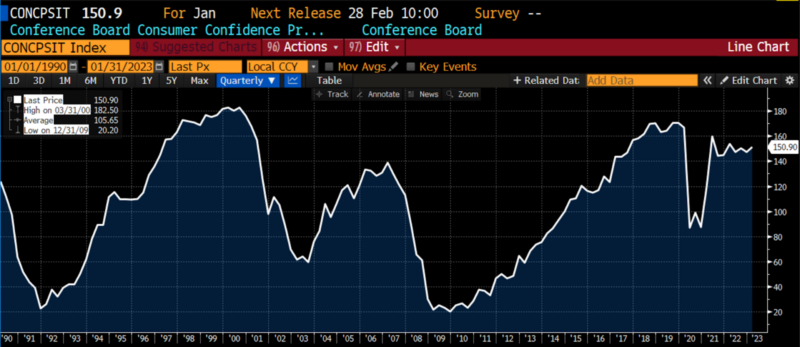
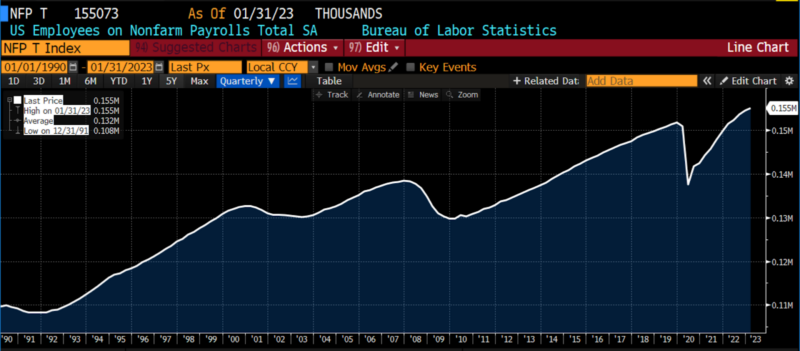
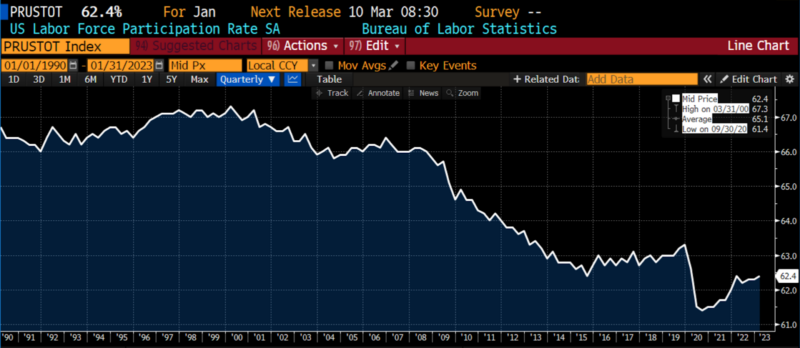
Our Roughly Coincident Indicators fell to 50 from 83 in January 2023, with all six component indices in neutral trends over their December readings. Nonfarm payrolls, industrial production, personal income (less transfer payments), the labor participation rate, consumer confidence, and manufacturing and trade sales changed negligibly over the December 2022 levels, falling to the neutral threshold. This is the first time the Roughly Coincident Indicator has been neutral since October 2020, twenty-seven months ago.
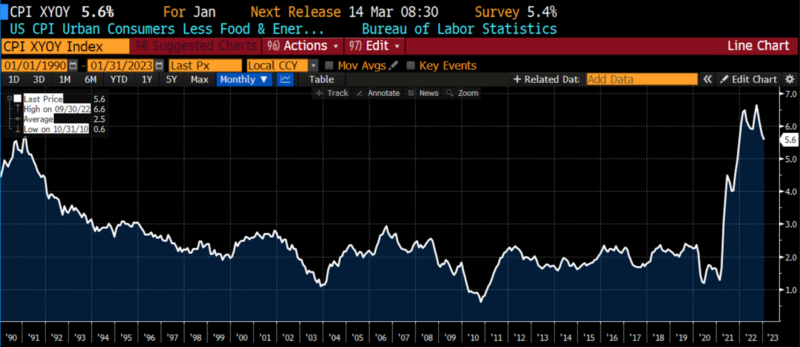
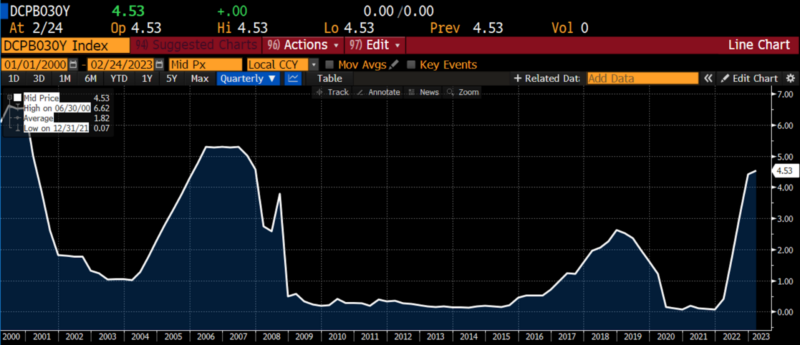
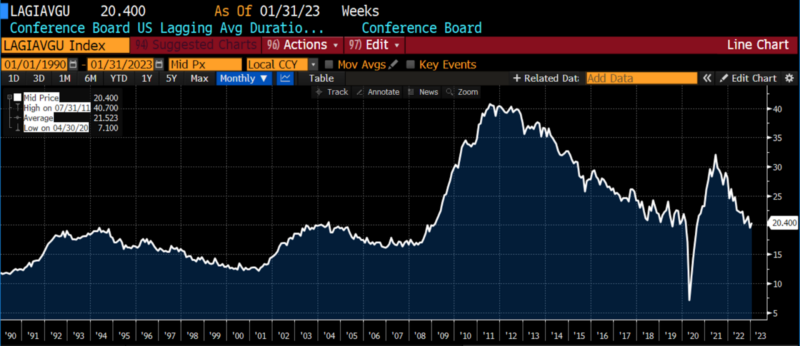
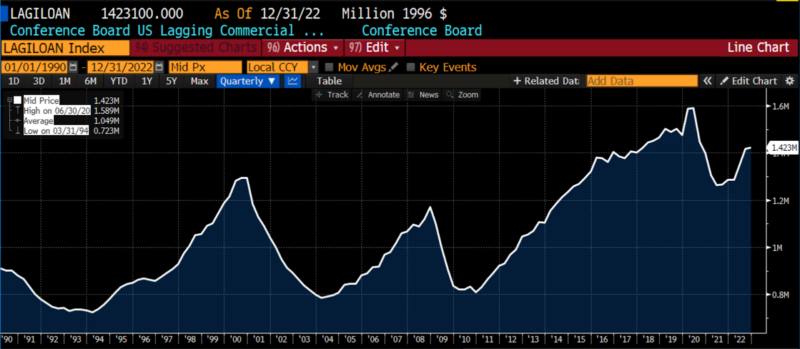
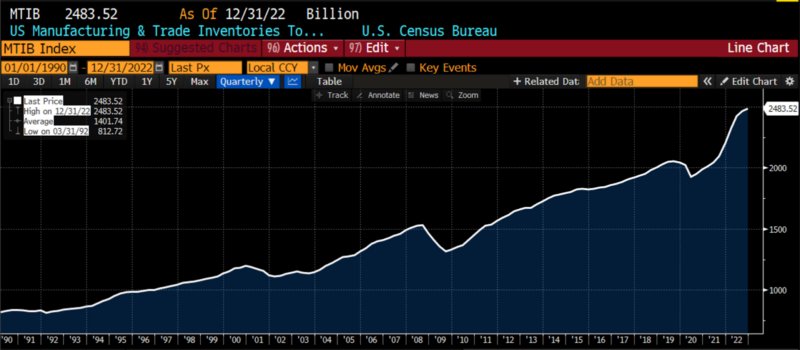
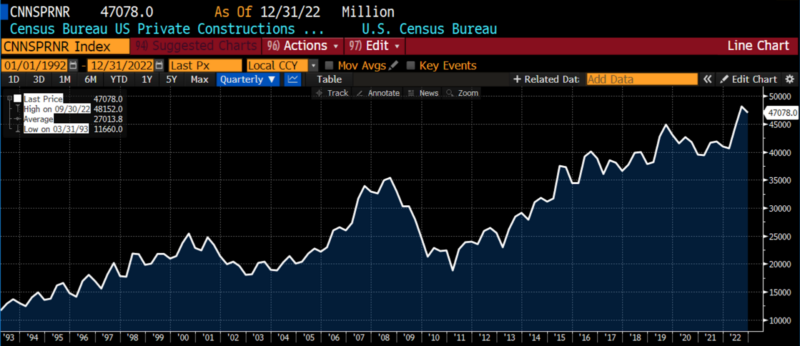
The Lagging Indicators also fell from 83 in December 2022 to 50 in January 2023. As was the case with the Roughly Coincident Indicators between December and January, small but quantitatively insignificant changes in the constituents–CPI (core, year-over-year), short-term interest rates, outstanding commercial and industrial loans, manufacturing and trade inventories, private nonresidential construction, and average duration of unemployment–shifted the bias of lagging indicators to neutral levels.
The pervasively neutral bias among all three categories and subcategories of the Business Conditions Monthly diffusion indices is likely not consistent with randomness. The most likely explanation is that the rebound from the brief 2022 recession is slowing under the lagged effects of a historically rapid contractionary monetary regime settling in.
Leading Indicators
January 2023 nonfarm payroll employment rose by 517,000, with most gains in hospitality, leisure, healthcare, professional and business services. The unemployed rate stands at 3.4 percent, having not changed substantially since early 2022. Both the employment-population ratio (60.2 percent) and the labor force participation rate (62.4 percent) have remained stable throughout 2022 and remain substantially below their February 2020 levels of 61.1 percent and 63.3 percent, suggesting persistent long-term structural changes to US labor markets in the wake of pandemic mitigation policies.
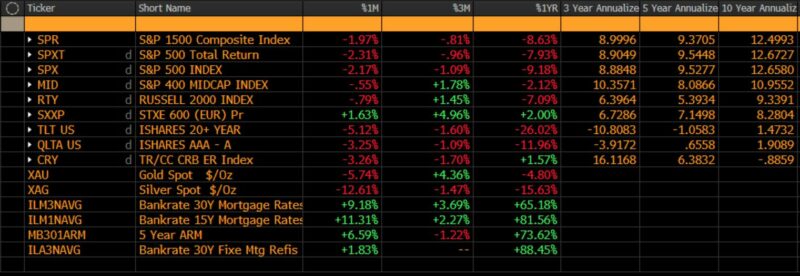
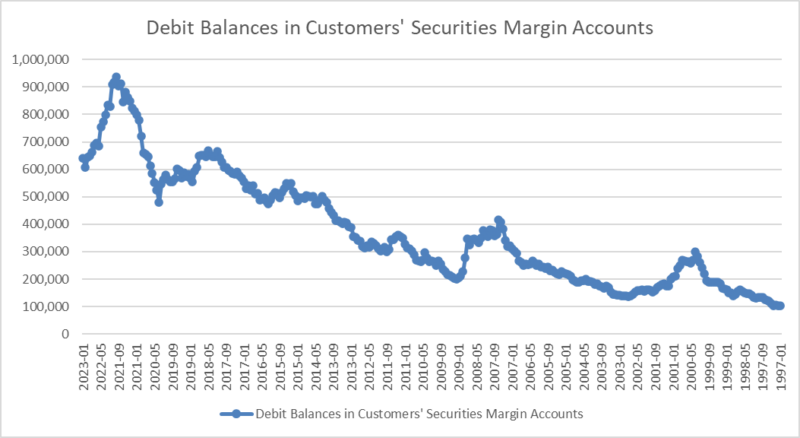
Debits in brokerage margin accounts increased in January 2023. This often suggests optimism (or bullish financial market outlooks), but the present levels are much lower than their early 2022 levels. The 1 year-10 year US Treasury spread narrowed by roughly eight basis points, a small but positive relaxation of one specific inversion of the US Treasury yield curve. The remainder of the indicators notched small but inconsequential gains or losses month-over-month.
Coincident & Lagging Indicators
Like most of the leading indicators, all six coincident and lagging indicators were essentially neutral in January 2023.
The last time that the Leading (58), Roughly Coincident (50), and Lagging Indicators (50) simultaneously indicated neutral biases occurred in March 2020, with respective readings of 54, 58, and 50. At that time, an already slowing US economy was blindsided by both Covid fears and the first wave of Covid policy measures, leading to generational and, in some cases, historical levels of uncertainty and fear.
It is likely that the neutral indications currently dominating the three Business Conditions Monthly indices are tied to a weak recovery from the brief 2022 recession, rising interest rates amid an increasingly unclear path for both inflation and monetary policy, the ongoing debt ceiling stalemate, and mounting geopolitical tensions between the US, Russia, and China. Risks, already elevated, are mounting.
LEADING INDICATORS (1990 – present where possible)












ROUGHLY COINCIDENT INDICATORS (1990 – present where possible)






LAGGING INDICATORS (1990 – present where possible)






CAPITAL MARKET PERFORMANCE
